S&P E-Mini Futures Intraday Targets For Monday, Jan. 27
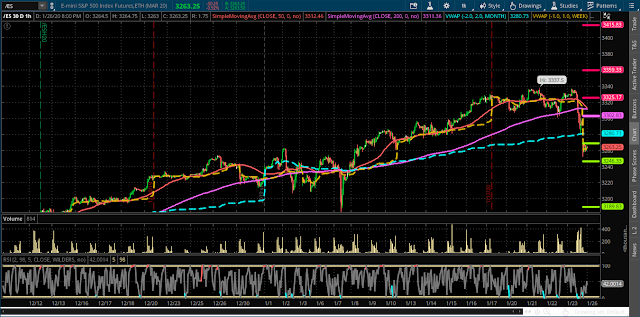
Monday's (January 27) intraday Pivot Point targets for the S&P Emini Futures Index (ES) are (as shown on the following 30-day 60-min chart):
R3 = 3415.83
R2 = 3359.33
R1 = 3325.17
PP = 3302.83
S1 = 3268.67
S2 = 3246.33
S3 = 3189.83
Weekly VWAP = 3262.10
Monthly VWAP = 3280.73
50-hr MA = 3312.46
200-hr MA = 3311.36
*Note that the 50-hr MA is about to cross below the 200-hr MA on this 60-min timeframe...hinting of further weakness ahead if a crossover holds.
All of these levels represent intraday support and resistance levels for Monday.
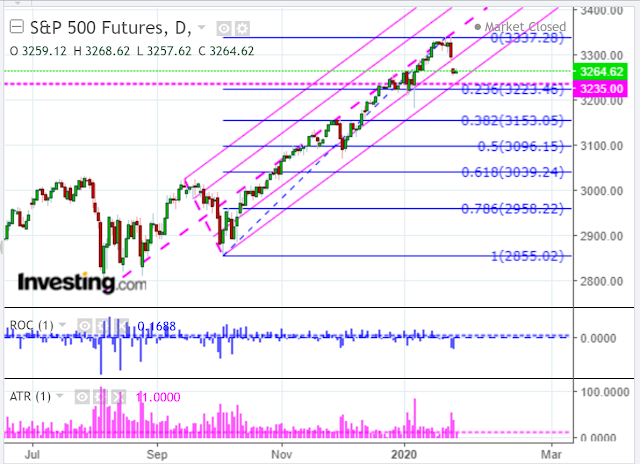
The following daily chart of the ES contains an Andrew's Pitchfork and a Fibonacci Retracement study.
The near term support level is around the 3223 to 3235 zone... a convergence of the bottom of the pitchfork channel and the 23.6 Fib retracement level. This zone is also the closest in price to the S2 pivot point level (3246.33). As I write this post-Sunday night around 11:30 pm ET, the ES is hovering just above S2. A break and hold below this price could send the ES to its next support level at 3189.83 (S3).
We've not yet seen an extreme spike on the Rate of Change (ROC) indicator and the Average True Range (ATR), so Sunday's night's drop may not yet be finished. Note that I've shown the input value of each of these indicators as one period and in histogram format to show (in an exaggerated view) where the extreme spikes occurred in the past, which tend to represent, either a turning point or a level at which consolidation occurs before a trend reversal takes place.
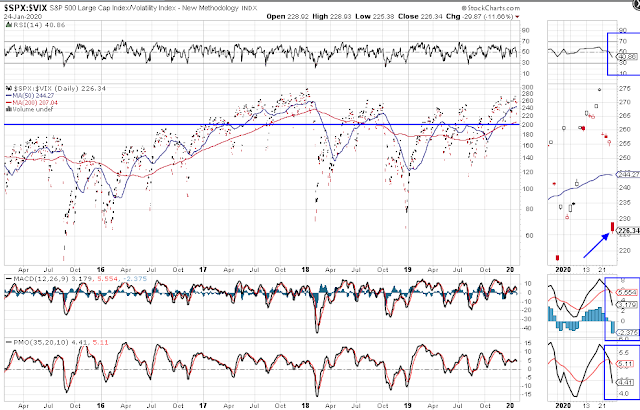
Finally, the following daily ratio chart of the SPX:VIX ratio shows that price has dropped below the 50 MA and may be headed down to the 200 MA around the 200 price support level.
The RSI has dropped below the 50 level, and both the MACD and PMO indicators have formed a bearish crossover, all of which are hinting of lower prices on the SPX and higher volatility in the near term.
If the ES breaks and holds below S2 (3246.33), prepare for a potential drop to S3 (3189.83) and a retest of 200 (or lower) on the SPX:VIX ratio.