S&P CoreLogic Case-Shiller 20 City Home Price Index September 2019 Year-Over-Year Growth Now 2.1%
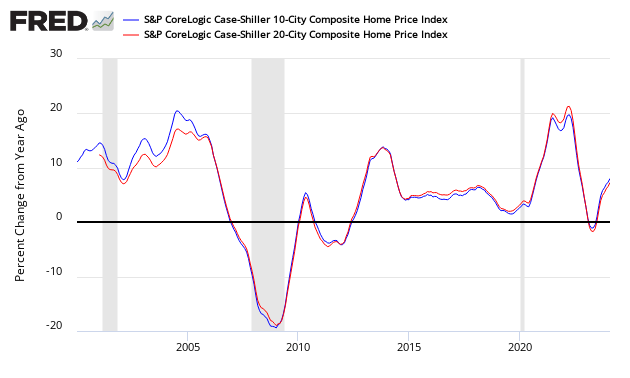
The non-seasonally adjusted S And P CoreLogic Case-Shiller home price index (20 cities) year-over-year rate of home price growth improved from 2.0 % to 2.1 %. The index authors stated, "After a long period of decelerating price increases, it's notable that in September both the national and 20-city composite indices rose at a higher rate than in August".

Analyst Opinion of Case-Shiller HPI
All home price indices are now showing home price growth is accelerating year-over-year.
- 20 city unadjusted home price rate of growth accelerated by 0.1 % month-over-month. [Econintersect uses the change in year-over-year growth from month-to-month to calculate the change in the rate of growth]
- Note that the Case-Shiller index is an average of the last three months of data.
- The market expected from Econoday: [not updated yet]
| Consensus Range | Consensus | Actual | |
| 20-city, SA - M/M | 0.2 % to 0.3 % | +0.3 % | +0.4 % |
| 20-city, NSA - M/M | +0.1 % | ||
| 20-city, NSA - Yr/Yr | 1.7 % to 2.5 % | +2.0 % | +2.1 % |
S&P/Case-Shiller Home Price Indices Year-over-Year Change

Comparing the NAR and Case-Shiller home price indices, it needs to be understood each of the indices uses a unique methodology in compiling their index - and no index is perfect.
The way to understand the dynamics of home prices is to watch the direction of the rate of change. Here home price growth generally appears to stabilize (rate of growth not rising or falling).
There are some differences between the indices on the rate of "recovery" of home prices.
When asked what today's release means for the housing market, Dr. Ralph B. McLaughlin, deputy chief economist, and executive of research and insights for CoreLogic said:
While stubbornly low mortgage rates have put the kibosh on the great housing market cooldown, the boom and bust patterns of home price growth in the West appear to be now solidly on the bust side. Both San Francisco and Las Vegas - once emblems of the housing market gold rush - have turned into ghost towns, relatively speaking, over the past year. While not great news from new homeowners, first-time buyers looking to get their foot in the door of homeownership might have something new to be thankful for this holiday season
A synopsis of Authors of the Leading Indices:
Case Shiller's Craig J. Lazzara, Managing Director and Global Head of Index Investment Strategy at S&P Dow Jones Indices stated:
September's report for the U.S. housing market is reassuring,. The national composite index rose 3.2% relative to year-ago levels, with smaller increases in our 10- and 20-city composites. Of the 20 cities in the composite, only one (San Francisco) saw a year-over-year price decline in September.
After a long period of decelerating price increases, it's notable that in September both the national and 20-city composite indices rose at a higher rate than in August, while the 10-city index's September rise matched its August performance. It is, of course, too soon to say whether this month marks an end to the deceleration or is merely a pause in the longer-term trend.
At a regional level, Phoenix retains the top spot for the fourth consecutive month with September's 6.0% year-over-year gain. The Southeast region was also strong, as Charlotte, Tampa, and Atlanta all rose at greater than a 4.0% clip.
CoreLogic believes affordability is now improving (September 2019 Data). Per Dr. Frank Nothaft, chief economist at CoreLogic and Frank Martell, president and CEO of CoreLogic stated:
Mortgage rates were a full percentage point lower this September compared to a year ago, boosting affordability for first-time buyers and supporting a rise in homeownership. In addition to lower interest rates, personal income grew faster than home prices during the past year. This provided an additional lift for first-time buyer affordability and helped to boost the homeownership rate to the highest level in more than five years.
All 50 states posted positive home price trends in September with the average price nationally rising 3.5%. As a group, more millennials are entering the home-buying market and they report spending more money than they anticipated. This may impact their future financial planning. Millennials age 30-38 put down less than 20% for a down payment over the past three years and used funds from their retirement accounts to cover an average of 7% of that down payment.
The National Association of Realtors says (October 2019 data):
Lawrence Yun, NAR's chief economist, said this sales increase is encouraging and he expects added growth in the coming months. "Historically-low interest rates, continuing job expansion, higher weekly earnings and low mortgage rates are undoubtedly contributing to these higher numbers," said Yun. "We will likely continue to see sales climb as long as potential buyers are presented with an adequate supply of inventory."
"The issuance of more housing permits is a very positive sign and a good step toward more inventory," said Yun, citing the latest data for housing starts. "In order to better counter and even slow the increase in housing prices, home builders will have to bring additional homes on the market."
"It is great to see home sales rise along with an increase in housing permits," said NAR President Vince Malta, broker at Malta & Co., Inc., in San Francisco, CA. "Both home buyers and the home sellers are being rewarded by these developments, and we see that conditions remain extremely favorable for real estate investment in America."
The U.S. Federal Housing Finance Agency produces an All-Transactions House Price Index for the United States:

Econintersect publishes knowledgeable views of the housing market.
Caveats on the Use of Home Price Indices
The housing price decline seen since 2005 varies by zip code - and seems to have ended somewhere around the beginning of the 2Q2012. Every area of the country has differing characteristics. Since January 2006, the housing declines in Charlotte and Denver are well less than 10%, while Las Vegas home prices had declined almost 60%.
Each home price index uses a different methodology - and this creates slightly different answers.
The most broadly based index is the US Federal Housing Finance Agency's House Price Index (HPI) - a quarterly broad measure of the movement of single-family house prices. This index is a weighted, repeat-sales index on the same properties in 363 metro centers, compared to the 20 cities Case-Shiller.
The US Federal Housing Finance Agency also has an index (HPIPONM226S) based on 6,000,000 same home sales - a much broader index than Case-Shiller. Also, there is a big difference between home prices and owner's equity (OEHRENWBSHNO) which has been included in the graph below.
Comparing Various Home Price Indices to Owner's Equity (blue line)


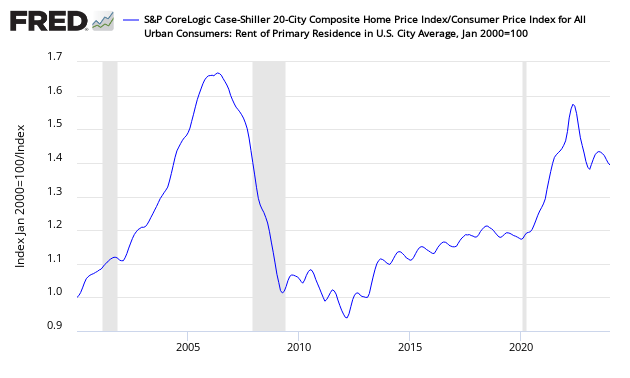
The affordability factor favors rental vs owning.
Price to Rent Ratio - Indexed on January 2000 - Based on Case-Shiller 20 cities index ratio to CPI Rent Index

Disclaimer: No content is to be construed as investment advise and all content is provided for informational purposes only.The reader is solely responsible for determining whether any investment, ...
more


