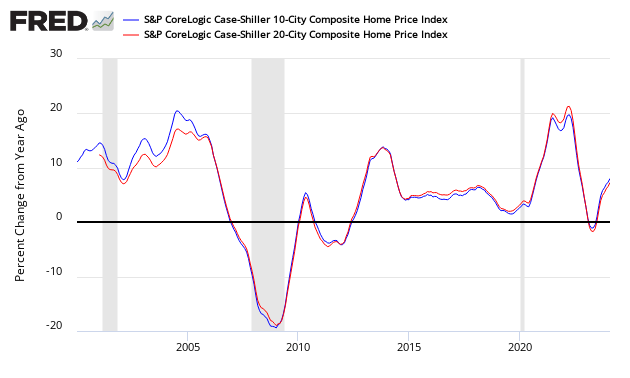
S&P CoreLogic Case-Shiller 20 City Home Price Index August 2020 Year-Over-Year Growth Accelerates
The non-seasonally adjusted S&P CoreLogic Case-Shiller home price index (20 cities) year-over-year rate of home price growth increased. The index authors stated, "Prices were strongest in the West and Southeast regions, and comparatively weak in the Midwest and Northeast".
Analyst Opinion of Case-Shiller HPI
Please note from the authors:
Please note that transaction records for July 2020 for Wayne County, MI are now available. Due to delays at the local recording office caused by the COVID-19 lockdown, S&P Dow Jones Indices and CoreLogic were previously unable to generate a valid July 2020 update of the Detroit S&P CoreLogic Case-Shiller indices.
However, there are not a sufficient number of records for the month of August for Detroit. Since Wayne is the most populous county in the Detroit metro area, S&P Dow Jones Indices and CoreLogic are unable to generate a valid Detroit index value for the October release. When the sale transactions data fully resumes and sufficient data is collected, the Detroit index values for the month(s) with missing updates will be calculated.
All home price indices are now showing home price growth is accelerating year-over-year. At this point, it looks like the pandemic has little affected home prices (or sales for that matter).
- 20 city unadjusted home price rate of growth accelerated by 1.1 % month-over-month. [Econintersect uses the change in year-over-year growth from month-to-month to calculate the change in the rate of growth]
- Note that the Case-Shiller index is an average of the last three months of data.
- The market expected from Econoday:
| Consensus Range | Consensus | Actual | |
| 20-city, SA - M/M | 0.4 % to 0.7 % | +0.4 % | +0.5 % |
| 20-city, NSA - M/M | 0.2 % to 0.6 % | +0.3 % | +1.1 % |
| 20-city, NSA - Yr/Yr | 3.8 % to 4.9 % | +4.1 % | +5.2 % |
S&P/Case-Shiller Home Price Indices Year-over-Year Change

Comparing the NAR and Case-Shiller home price indices, it needs to be understood each of the indices uses a unique methodology in compiling their index - and no index is perfect.
The way to understand the dynamics of home prices is to watch the direction of the rate of change. Here home price growth is now accelerating.
There are some differences between the indices on the rate of "recovery" of home prices.
A synopsis of Authors of the Leading Indices:
Case Shiller's Craig J. Lazzara, Managing Director and Global Head of Index Investment Strategy at S&P Dow Jones Indices stated:
Housing prices were strong in August. The National Composite Index gained 5.7% relative to its level a year ago, well ahead of July's 4.8% increase. The 10- and 20-City Composites (up 4.7% and 5.2%, respectively) also rose at an accelerating pace in August. The strength of the housing market was consistent nationally - all 19 cities for which we have August data rose, and all 19 gained more in the 12 months ended in August than they had done in the 12 months ended in July.
A trend of accelerating increases in the National Composite Index began in August 2019 but was interrupted in May and June, as COVID-related restrictions produced modestly-decelerating price gains. We speculated last month that the accelerating trend might have resumed, and August's results easily bear that interpretation. The last time that the National Composite matched August's 5.7% growth rate was 25 months ago, in July 2018. If future reports continue in this vein, we may soon be able to conclude that the COVID-related deceleration is behind us.
Phoenix's 9.9% increase topped the league table for August; this is the 15 th consecutive month in which Phoenix home prices rose more than those of any other city. Seattle (8.5%) once again took the silver medal, with San Diego (7.6%) in third place. It's a measure of housing's strength that even the worst-performing cities, Chicago (1.2%) and New York (2.8%), did better in August than in July. Prices were strongest in the West and Southeast regions, and comparatively weak in the Midwest and Northeast.
CoreLogic believes home demand will remain firm moving forward (August 2020 Data). Per Dr. Frank Nothaft, chief economist at CoreLogic and Frank Martell, president and CEO of CoreLogic stated:
The imbalance between homebuyer demand and for-sale inventory is particularly acute for lower-priced homes. Because of this imbalance, homes priced more than 25% below the median were up 8.6% in price over the last year, compared with the 5.9% price increase for all homes.
Consumers who have not been as financially impacted by the ongoing economic pressures are taking advantage of low mortgage rates to either break into the market, upgrade their living situations or purchase second homes and investment properties. With heightened activity putting a strain on the current for-sale inventory, strong demand should help spur new homebuilding activity.
From the National Association of Realtors (September 2020 data):
Home sales traditionally taper off toward the end of the year, but in September they surged beyond what we normally see during this season. I would attribute this jump to record-low interest rates and an abundance of buyers in the marketplace, including buyers of vacation homes given the greater flexibility to work from home.
There is no shortage of hopeful, potential buyers, but inventory is historically low. To their credit, we have seen some homebuilders move to ramp up supply, but a need for even more production still exists.
The uncertainty about when the pandemic will end coupled with the ability to work from home appears to have boosted sales in summer resort regions, including Lake Tahoe, mid-Atlantic beaches (Rehoboth Beach, Myrtle Beach), and the Jersey shore areas.
The U.S. Federal Housing Finance Agency produces an All-Transactions House Price Index for the United States:

Econintersect publishes knowledgeable views of the housing market.
Caveats on the Use of Home Price Indices
The housing price decline seen since 2005 varies by zip code - and seems to have ended somewhere around the beginning of the 2Q2012. Every area of the country has differing characteristics. Since January 2006, the housing declines in Charlotte and Denver are well less than 10%, while Las Vegas home prices had declined by almost 60%.
Each home price index uses a different methodology - and this creates slightly different answers.
The most broadly based index is the US Federal Housing Finance Agency's House Price Index (HPI) - a quarterly broad measure of the movement of single-family house prices. This index is a weighted, repeat-sales index on the same properties in 363 metro centers, compared to the 20 cities Case-Shiller.
The US Federal Housing Finance Agency also has an index (HPIPONM226S) based on 6,000,000 same home sales - a much broader index than Case-Shiller. Also, there is a big difference between home prices and owner's equity (OEHRENWBSHNO) which has been included in the graph below.
Comparing Various Home Price Indices to Owner's Equity (blue line)


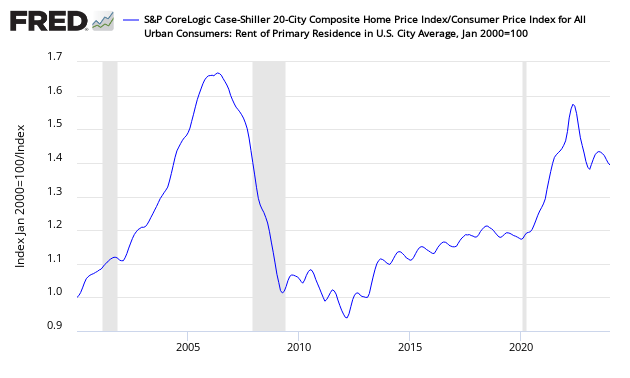
The affordability factor favors rental vs owning.
Price to Rent Ratio - Indexed on January 2000 - Based on Case-Shiller 20 cities index ratio to CPI Rent Index

Disclaimer: No content is to be construed as investment advise and all content is provided for informational purposes only.The reader is solely responsible for determining whether any investment, ...
more


