S&P At A Perilous Peak & Secular Bull High
My additional research of empirical data from 1871 to 2021 has resulted in the 4-new significant discoveries which pertain to record highs, Perilous Peaks, and Secular Bull market highs:
- The addition of the initial Perilous Peak, which occurred in 1881. The four S&P 500 Perilous Peaks since inception happened in 1881, 1929, 2000 & 2021.
- “DNA” for a Perilous Peak and development of the Extreme Analytics (EA) algorithm identifies Perilous Peaks.
- “Greed Accelerator,” one of the critical elements of the DNA which has preceded every one of the S&P 500’s Perilous Peaks since its inception.
- There is a direct correlation between Perilous Peaks, Secular Bull market highs, and the birth dates for Secular Bears.
The discoveries corroborate the initial research findings covered in the 1/16/21 article about my discovery of Perilous Peaks. Below is an excerpt from the article:
“The differentiation of a Perilous Peak from the hundreds of record highs which occur during the lifetime of a secular bull market is a game-changing breakthrough. It guides and empowers savvy investor to know when to get out and maximizes their after-tax profits.”
DNA
The DNA discovery is arguably the most important throughout my 44-year career. It answers the haunting question which thousands of investment professionals have struggled with throughout their careers, “When will the Secular Bull market end?”.
Until this DNA was discovered, the lifespan of a mature Secular Bull was anybody’s guess. Charles Dow, the creator of the Dow Jones Index, was the first to find out that markets were secular. Before his death in 1900, he said, “markets move like a pendulum, swinging from excessive gains to excessive losses.”
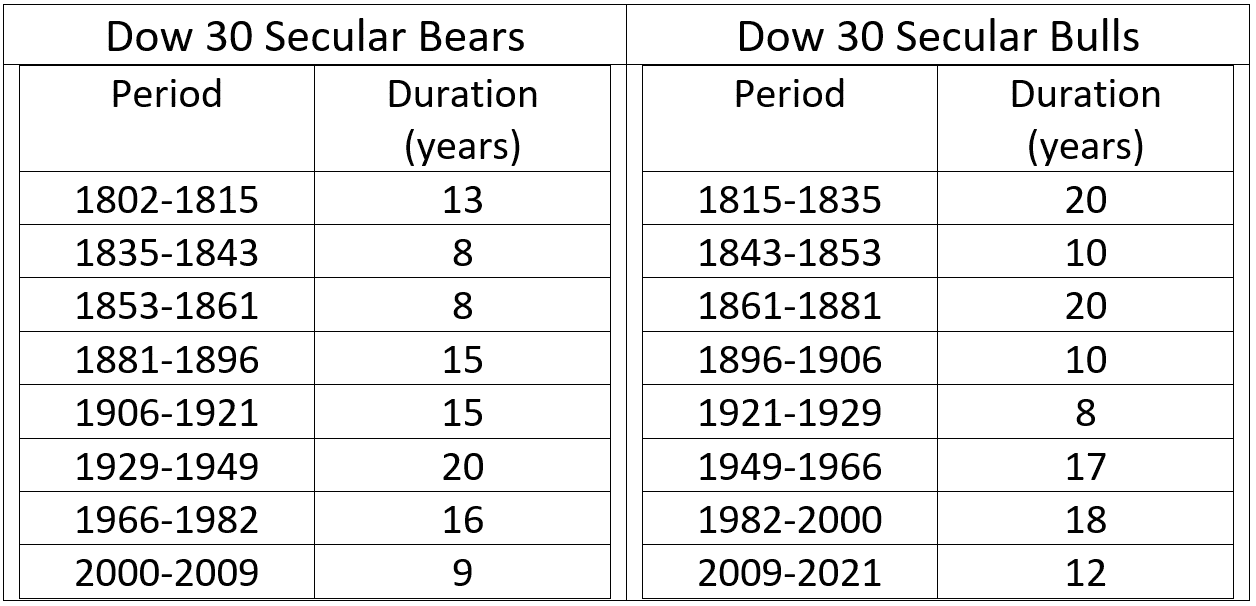
The table below contains the lifespans for all Secular Bull and Secular Bear markets for the Dow Jones 30 Industrials Composite Index from 1802 to 2021. All Secular Bull and Secular Bear markets for the Dow, since 1802, have had minimum lifespans of 8 years and maximum lifespans of 20 years. Because of the dizzying range of lifespans, predicting the end of a Secular Bull has been an exercise in futility until now.

Note: The research to discover the DNA for a Perilous Peak was conducted on the S&P 500 instead of the Dow. Since 1957, when the S&P was expanded to 500 members, the S&P index has been much more representative than the Dow.
The History
The chart below depicts (from 1929 to 2021) the S&P 500’s Perilous Peaks, Secular Bull highs, and the end for each Secular Bear. Perilous Peaks coincided with all but one of the secular bull highs.

Given the complexity of the four primary elements of the DNA, Perilous Peaks for the S&P 500 have been once-in-decades occurrences. The S&P 500’s first-ever record high, which possessed Perilous Peak DNA, was June of 1881. The second Perilous Peak occurred 48 years later in September 1929. The 2000 perilous peak occurred 71 years after 1929. The 4th January 2021 Perilous Peak occurred 21 years after the 2000 Perilous Peak.
As depicted in the table below, a Perilous Peak is followed by a devastating initial decline and a secular bear market. Within 3-years of the 1881 Perilous Peak and Secular Bull high, the S&P 500 had declined by 29%. The 1929 and 2000 were, within 3-years, followed by declines of 86.2% and 49%, respectively. After a Perilous Peak and Secular Bull high, the period for the S&P 500 to return to a record high ranged from 13 to 25 years.

Teflon
Research findings indicate that for an S&P 500 (SPX) record high to have Perilous Peak DNA always requires an entirely new generation of investors to be conditioned to trade the headline-grabbing, double-digit dips with the intent of making a quick profit. The new generation must not be privy to the wisdom of experience gained from the devastation which occurred after the prior Perilous Peak. This acceleration of greed for substantial gain (based on the bravado of their recent victories in double-digit dips) is the essential gas pedal necessary for them to climb to the summit of the Perilous Peak blindly.
Investors’ experience and success from double-digit trading corrections builds (often ill-advised) confidence and increases “Teflon-Esque” risk appetites, thereby; ensuring complacency. According to my empirical research findings, which are depicted in the charts below, after investors have been conditioned to buy the dips, they default to trading every double-digit correction until the strategy no longer works. Each correction and subsequent recovery encourage the investor to increase risk and speculation. This fuel is needed for a record high in the later years of a Secular Bull to be the “Perilous Peak.” A double-digit correction followed by a quick recovery to a new record high is the greed accelerator. Greed being at its highest level is mandatory for a record high to be the Perilous Peak.
1928-1932
The S&P 500’s annotated daily price charts from 1928 to 1932, shown below, exemplifies the role the greed accelerator plays during the germination of Perilous Peak DNA. From May to June 1928, the S&P 500 corrected by 10.2%. Within 61 days, the index completely recovered to establish a new record high. In September of 1929, the S&P 500 subsequently reached its Perilous Peak. After the index corrected by 10% in October 1929, the S&P 500 attempted to rally as it had done in 1928. Instead of getting back to a new high within the preestablished 61 days, the S&P 500 continued lower to a decline of 44% by November of 1929.

The chart below depicts that after mounting a feeble rally from its November 1929 low, the S&P 500 continued down. By June of 1932, the index had declined by 86.2% from its September 1929 high.

1998-2002
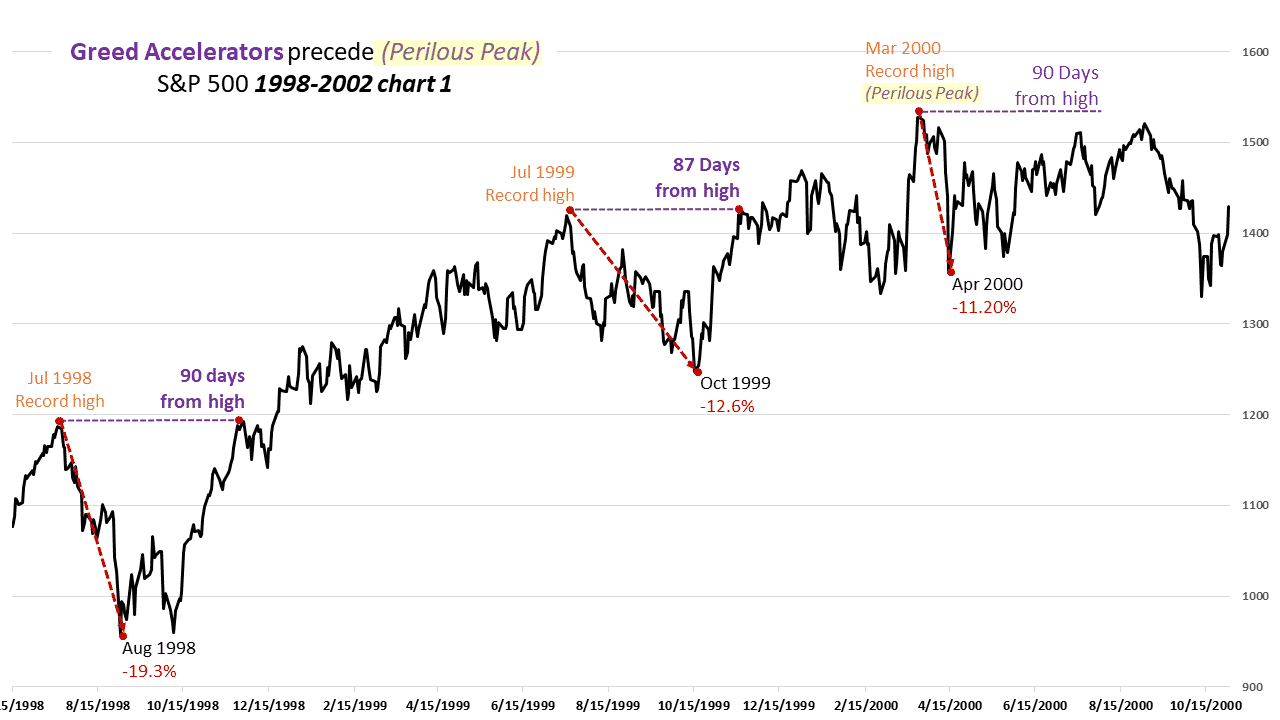
The S&P 500’s annotated price charts covering 1998 to 2002, shown below, represents another example of the “setup role” played by greed accelerators. From July 1998 to August 1998, the S&P 500 declined by 19.3%. Within 90 days, the index recovered to a new record high. In July 1999, one year later, the index experienced yet another double-digit decline. Within 87 days, the index recovered back to a new record high. After the S&P 500 corrected by 11.2% from March to April 2000, the index’s attempt to rally back to above the most recent record high within the previously established 90-day time period failed.

Instead, as depicted in the chart below, the S&P 500 by October 2002 had declined by 49%.

The evidence from my research findings is irrefutable. The S&P 500’s failure to get back to a record high within the pre-established period after each Perilous Peak had occurred confirmed that a Secular Bear market was underway.
2018-2021
The annotated price chart covering 2018 to 2020 for the S&P 500, shown below, are yet more examples. The S&P 500 recovered within 147 days to new highs after the two double-digit corrections in 2018. The recovery from the 34% March 2020 correction took 127 days.

The patterns of repetition in the above charts made it very clear that dips’ buying was a learned behavior. As depicted in the table below, the subsequent Perilous Peaks preceded an additional greed accelerator, provided additional support for my behavior theory. Population growth and easier access to market news by the public have steadily increased Greed Accelerators’ number preceding each Perilous Peak.

To prove the behavior theory, research was conducted on additional empirical data covering the S&P 500 from its 1871 inception through 1929. The study resulted in discovering the 1881 Perilous Peak, the fourth since the S&P 500’s conception.
1876-1900
As depicted in the S&P 500’s 1876-1900 monthly price chart below, the first 10% correction from a record high, which resulted in the learning of the “Greed Accelerator” behavior, occurred in 1880. After the S&P 500 had reached its March 1880 record high, the index corrected by 10.2% in May of 1980. Within 131 days, the S&P 500 climbed to a new record high in October of 1880. The index then recorded its first-ever Perilous Peak and Secular Bull market high in 1881. After correcting by 12.6%, the S&P 500 was unable to climb back within the preestablished 131 days. The index instead began a steady 15-year decline to its October 1896 low.

The chart below and my additional research findings reveal that the beginning (the birth date) of a Secular Bear also coincides with the high of a Secular Bull/Perilous Peak, thus making the start of a Secular Bear market entirely predictable. The birth and death dates for all Secular Bear and Secular Bull markets throughout history have coincided at the high of a Secular Bull. When the life of a Secular Bull ends at its high, a Secular Bear’s life begins. Conversely, a Secular Bull’s life begins at the bottom of a Secular Bear.

Secular Bear Births
The chart below depicts the birth dates and lifespans for all of the S&P 500’s Secular Bear and Secular Bear markets from 1929 to 2021. The chart also shows the Perilous Peaks, which coincided with the 1929, 2000, and 2021 Secular Bear birth dates.

The table below contains the critical statistics for the 4 Secular Bears in the above chart. The recoveries back to the prior Secular Bull’s high were much longer for those Secular Bears with birth dates coinciding with a Perilous Peak.

The extended downturns for the S&P 500 after a Secular Bull high fully supports the following thesis:
- every Secular Bull high requires the emergence of a new generation of speculators
- each Secular Bull high is followed by a minimum initial decline of 32%
- every Secular Bull high is followed by a minimum extended decline of 37%
- the period for the S&P 500 to recover to its prior Secular Bull high ranges from 8 to 25 years
Author: Michael Markowski has worked in Capital Markets since 1977. He spent the first 15 years of his career in the Financial Services Industry as a Stockbroker, Portfolio Manager, Venture ...
more


