
S&P And Nasdaq Follow Russell 2000 Lower On Confirmed Distribution
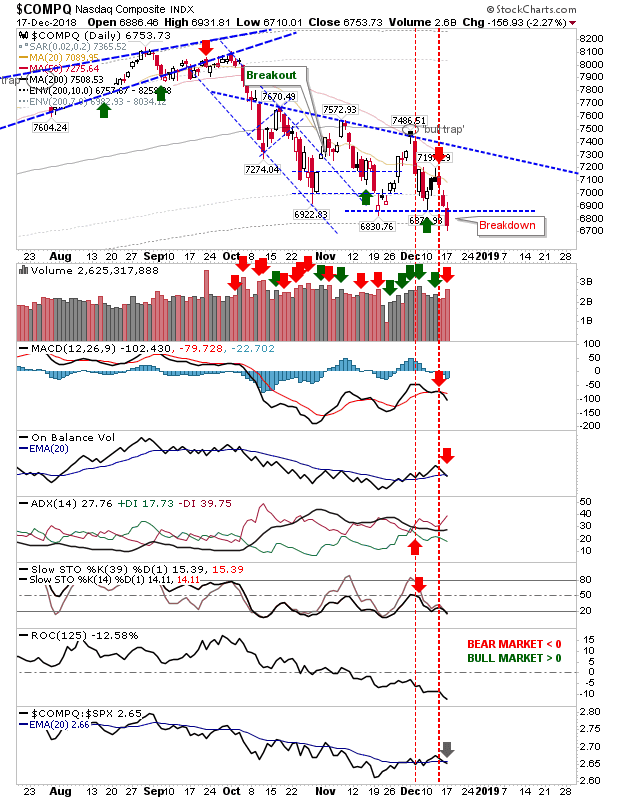
Sellers stayed on for another day as it was the turn of the S&P and Nasdaq to follow the losses of the Russell 2000 from Friday. Volume picked up in confirmed distribution, suggesting there was substance behind today's selling. On the investment front, the S&P moved into the "10% zone" of historic price action (i.e. 90% of S&P action dating back to 1950 was better than what we are seeing now); it's another accumulate buy for those looking to build a long-term investment. The Nasdaq was only 0.4% from doing likewise - completing the history trip back to February 2016. After that, we are looking at 2008 and 2011 style corrections.
The S&P undercut the 'bullish hammer', negating the pattern. Looking at the weekly chart the next support levels are down at 2,195 and 2,085. I would be surprised if the S&P got down there but you'll never know what may happen in the coming weeks or months.


The Nasdaq is sitting in a similar position to the S&P; a confirmed breakdown on bearish net technicals. Like the S&P, nearest support is a long way away: 5,340 and 5,035, but first will be watching for a 'bull trap'.

The Russell 2000 sits at 14.4% below its 200-day MA, only 0.3% from a "Strong Buy" on my investor watch. Investors can keep working it by adding to positions. Unlike the S&P and Nasdaq there are nearby support levels to work, one of which can be found in the 1,335-1,350 zone (support for most of 2017). Traders looking for a bounce trade can probably start looking here.

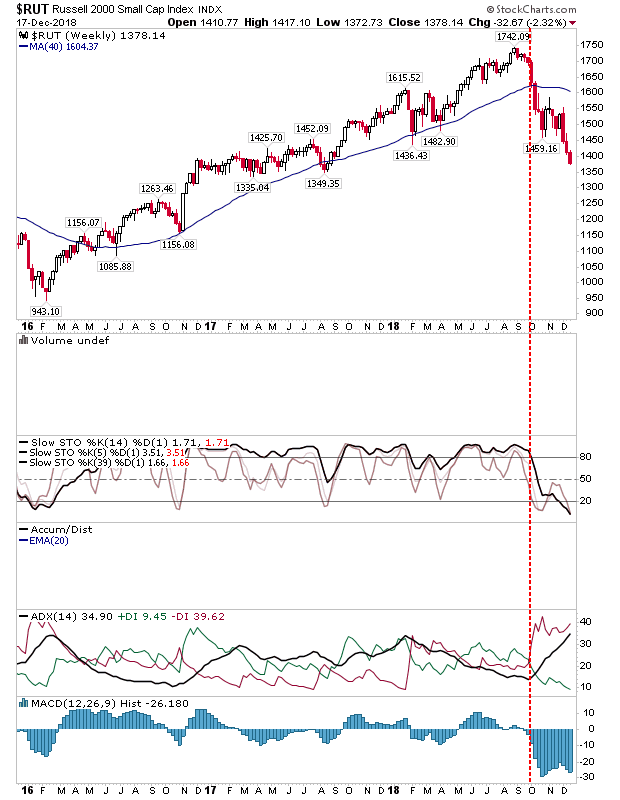
For tomorrow, investors can keep on building their positions across all markets. Traders can probably start to look at buying the Russell 2000 and potentially covering any shorts in play.


