
S&P And Dow Jones Losing Streak May Not End Just Yet: Analysts Revisiting Outlook
Without a recognizable and verifiable path forward for U.S./China trade talks, the narrative is quickly shifting toward a “no deal” outcome. Bond yields are, however, recognizably lower on Tuesday and after a long 3-day, Memorial Day weekend. The 10-year Treasury yield is at its lowest level since October 2017 and seemingly pricing in a “no deal” outcome between the two trading partners. Also on the global trade radar over the extended weekend was President Donald Trump’s visit to Japan.
Trump pointed to the U.S.’s continuing “unbelievably large” trade imbalance with Japan, but he also said a trade deal was coming later this year, noting he expects it “sometime into the future.” Many economists and trade experts were actually expecting a deal to come out of this meeting between Prime Minister Abe and President Trump. For now, worries about trade friction between the U.S. and China, as well as the friction between the U.S. and Japan, will continue to linger.
What is playing out amongst the analyst community is now a more cautious tone on trade; to some extent, the specter of a “no deal” scenario is being more greatly considered. Finom Group remains of the opinion that a true trade deal that brings China more closely in line with all WTO rules and regulations surrounding global trade is unlikely. The language and requests put forth by the U.S. in negotiations with China trade delegates all but asks the 2nd largest economy to admit to improprieties and theft with respect to trade activity. That, in and of itself, is a nonstarter for China and has always been.
The more likely outcome in trade talks between the U.S./China is that the latest tariffs implemented are removed in favor of China buying more U.S. agriculture and energy-related goods. That would essentially close some of the trade deficit gap and allow for President Trump to walk away with some sort of win, even if this was already on the table long ago. Moreover, China could further open its markets to foreign corporations while elevating the monitoring of technology IP usage by foreign entities in the region. “At the end of the day”, none of the aforementioned lend favorably to actual oversight and make the last 18 months of trade feuding and upheaval of global trade appear erroneously sponsored. With that being said, here is what CFRA’s Lindsey Bell and other analysts wrote last week on the subject matter and as it proposes to impact U.S. equity investors.
“While we, like most investors, are hopeful that a trade deal gets done sooner rather than later, we don’t think hoping for the best is the ideal way to invest.”
“We don’t think this expansion is over, we think the stock market has some new highs in it…but certainly what you need is better hopes for a deal and you need some more confidence that the global growth story is going to stabilize,” said Scott Wren, senior global equity strategist at Wells Fargo Investment Institute.”
Scott Minerd, global chief investment officer at Guggenheim Investments, warned in a Thursday note that the “war is at hand.” Unless the current trajectory is quickly changed, the Chinese are digging in for a long fight. The cost to the United States will be high; the cost to the Chinese will be higher. The only question is who will endure and be the most innovative in this battle of wills.
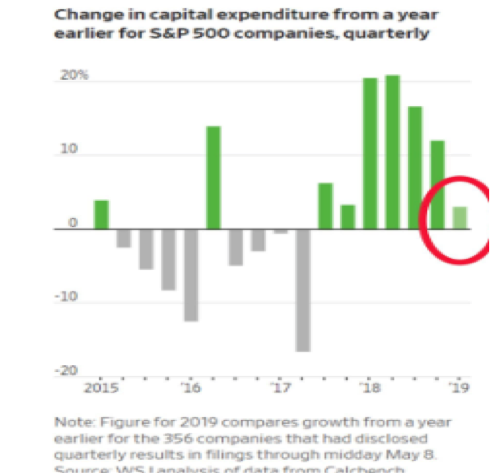
Trade wars hurt business sentiment and eventually business investment is curtailed. We’ve already witnessed what the threat of additional tariffs in the ever-escalating feud between the U.S. and China has done to capital expenditures in the first quarter of 2019.
Additionally, with the Q1 2019 earnings season near completion, corporations are guiding without the implementation of another round of tariffs. That’s the main issue that still lay ahead of corporates and investors. If another round of tariffs is implemented it has the potential to wipe out the earnings rebound that is largely been anticipated for the back half of 2019. At present and according to FactSet, for the first quarter, S&P 500 companies are reporting a decline in earnings of -0.4% and growth in revenues of 5.3 percent. For the remainder of 2019, analysts see a decline in earnings in the second quarter, slight growth in earnings in the third quarter, and single-digit growth in earnings in the fourth quarter.
- For Q2 2019, analysts are projecting a decline in earnings of -2.1% and revenue growth of 4.1%.
- For Q3 2019, analysts are projecting earnings growth of 0.3% and revenue growth of 4.2%.
- For Q4 2019, analysts are projecting earnings growth of 7.2% and revenue growth of 4.6%.
- For CY 2019, analysts are projecting earnings growth of 3.2% and revenue growth of 4.7%.
- The forward 12-month P/E ratio is 16.1. This P/E ratio is below the 5-year average of 16.5 but above the 10-year average of 14.8. It is also below the forward 12-month P/E ratio of 16.4 recorded at the end of the first quarter (March 31).
CFRA’s Bell thinks there is downside risk to the second-half earnings growth outlook, while noting that the downside could be “minimal” if there’s no further escalation in tariffs and if consumers, buoyed by increased wages, higher home prices, more job opportunities, and increased productivity can support U.S. economic growth by absorbing the higher costs of trade.
Wells Fargo’s Wren said, “You don’t want to have a big bet on right now, but you want to at least have a little bet on. “It just seems like it could either way, at least in the short term.”
A more ominous tone is being struck by analysts for the back half of 2019, which was previously seen as the potential hockey stick portion of the earnings picture for the year. JPMorgan's Nikolaos Panagirtzoglou, whom has been rather sanguine on the prospectus for 2019 earnings has once again offered his latest insights in comparing 2018 to 2019. Panagirtzoglou writes that we find that "there are three main differences between the current environment and last year:
- bond yields are falling this year rather than rising,
- the US repatriation flow is much reduced and
- there is less growth divergence between US and non-US economies.
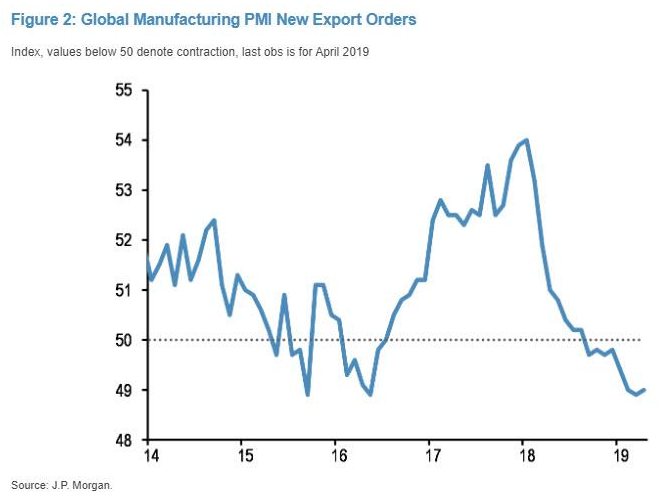
One issue Panagirtzoglou points to is the new export orders component of the global manufacturing PMI, which looked vulnerable even before the re-escalation of the past two weeks. The New Export Orders index of the Global Manufacturing PMI has been persistently weak, hovering below the 50 level since last September. The next monthly reading for May due on June 3rd will reveal the impact that the recent escalation of trade war risks had on this forward-looking indicator of global trade.
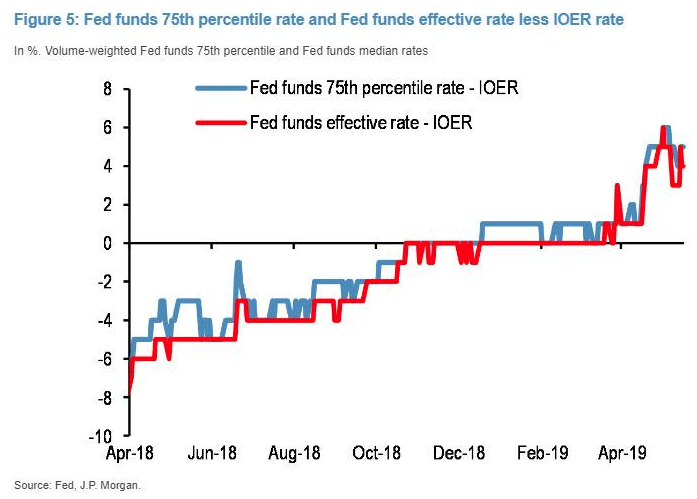
While economic uncertainty continues to record high levels, one thing that has remained a constant since 2018 is the U.S. Dollar Index strength. Up until the end of March, the Fed’s QT or balance sheet shrinkage was masked as it was offset by the decline of the US Treasury’s account balance at the Federal Reserve. As Panagirtzoglou notes, as the Treasury account balance normalized in April, the Fed’s balance sheet shrinkage manifested abruptly via a sharp $170bn decline in dollar reserves within three weeks. This caused abrupt tightening in the reserve and dollar liquidity space, pushing the Fed funds rate to well above the Fed’s effective policy rate, i.e. the Interest on Excess Reserves (IOER) rate. While a previous spike in both the median and 75th volume-weighted percentiles of the Fed funds rate to 3bp above the IOER rate around first quarter-end was quickly unwound, these rates spiked again over the past four weeks to 3bp-6bp above the IOER rate creating a more persistent and concerning up move.
The persistent uptick is raising questions about whether dollar reserves are in tight territory already. The U.S. Dollar strength continues to hurt emerging markets.
In addition to the aforementioned dollar reserve tightening conditions is the noticeable downtrend in U.S. bond yields, which is also in stark contrast to 2018 whereby bond yields steadily rose. What does this difference in bond market performance this year vs. last year mean? One suggested proposal is that this year’s strong bond market performance is currently creating easier financial conditions relative to last year, especially in the US where 30-year mortgage rates (at 4% currently) are down by 50bp YTD compared to a 100bp increase between January and October last year. So it is less likely, the argument goes, this time to see a repeat of the Q4 2018 correction given that current financial conditions are so much easier than the tight financial conditions and high bond yields prevailing in September 2018 ahead of the Q4 correction.
J.P. Morgan does not buy this argument, and points out that a casual inspection of the Chicago Fed’s Adjusted National Financial Conditions Index (shown below), which adjusts for the state of the business cycle and the level of inflation to isolate a financial-only element of conditions, shows that US financial conditions were even easier in September 2018, ahead of the Q4 correction, than they are at the moment. In other words, the picture of Figure 5 is not consistent with the idea that higher bond yields had caused tight financial conditions by September 2018, potentially inducing the Q4 correction.
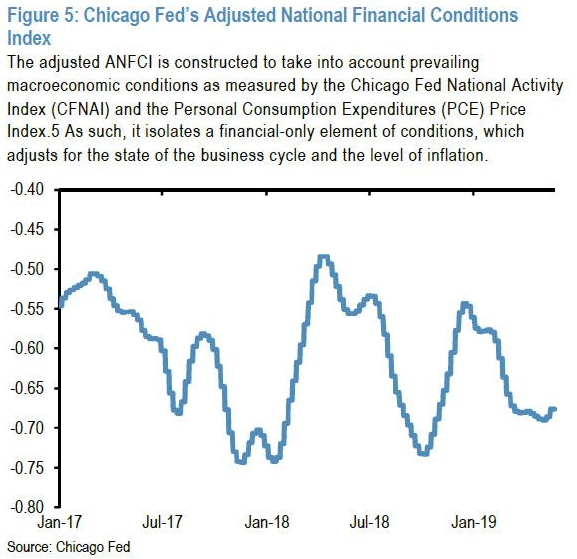
While there’s no arguing against what the chart outlines, we can certainly argue that the ANFCI is not the only measure of fiscal conditions. If we only look at bank lending and housing data over the course of 2019, we are forced to recognize that fiscal conditions remain relatively loose and stable as yields have ticked lower and with the prospectus of the Fed ending its QT program in September.
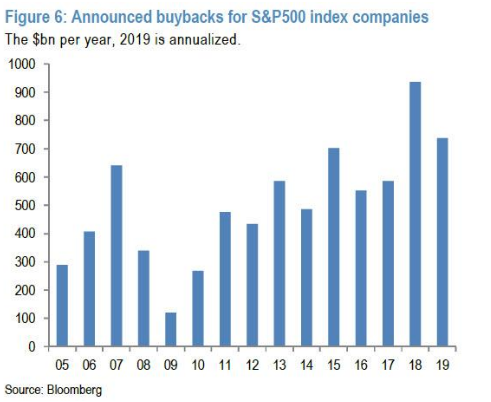
Another key concern for the U.S. equity market outlook outlined by J.P. Morgan’s team centers on buybacks. “Assuming the U.S. repatriation flow is largely behind us, this creates downside risk to U.S. share buybacks and capex growth this year relative to last year and upside risk to U.S. corporate bond issuance. Indeed, announced U.S. share buybacks in the first five months of the year are tracking a pace that is more than 20% below the pace for the same period of last year.”
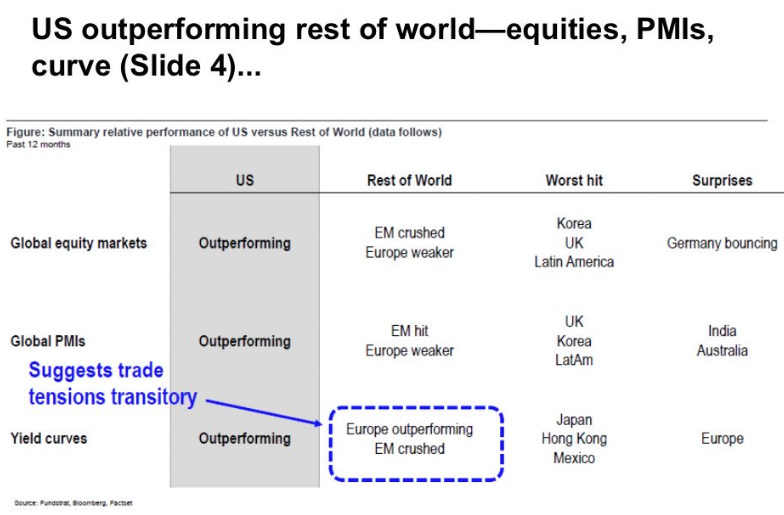
“The downside risk for risky markets emanating from similarities to last year such as elevated trade war risks, dollar strengthening, a deterioration in the inversion at the front end of the U.S. curve and the strong outperformance of U.S. equities relative to their non-U.S. counterparts remain of concern."
J.P. Morgan holds steady with its call for the S&P rising to 3,000 by the bank's head quant Marko Kolanovic. At the same time, J.P. Morgan's permabearish analyst Nikolaos Panigirtzoglou is there to suggest rising caution for this call and market outlook in 2019.
With J.P. Morgan front and center in today’s daily market dispatch, we also take notice of the firm’s lowered Q2 2019 GDP forecast. The firm says they now see much slower second-quarter growth of just 1%, down from their prior forecast of 2.25 percent.
“The April durable goods report was bad, particularly the details relating to capital goods orders and shipments. Coming on the heels of last week’s crummy April retail sales report, it suggests second quarter activity growth is sharply downshifting from the first quarter pace, ” the economists wrote.
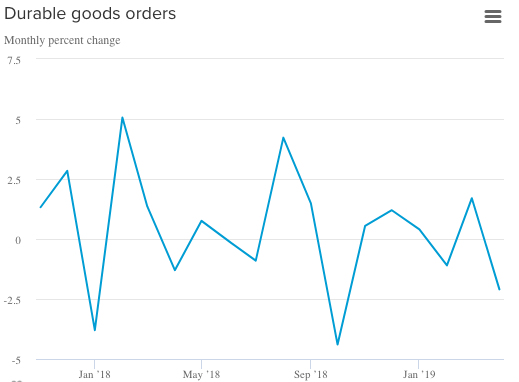
In the April durable goods report, total orders at manufacturers declined 2.1% last month, due to large declines of aircraft and motor vehicle orders. Beyond transportation, the J.P. Morgan economists noted that orders were flat last month and revised significantly lower in March.
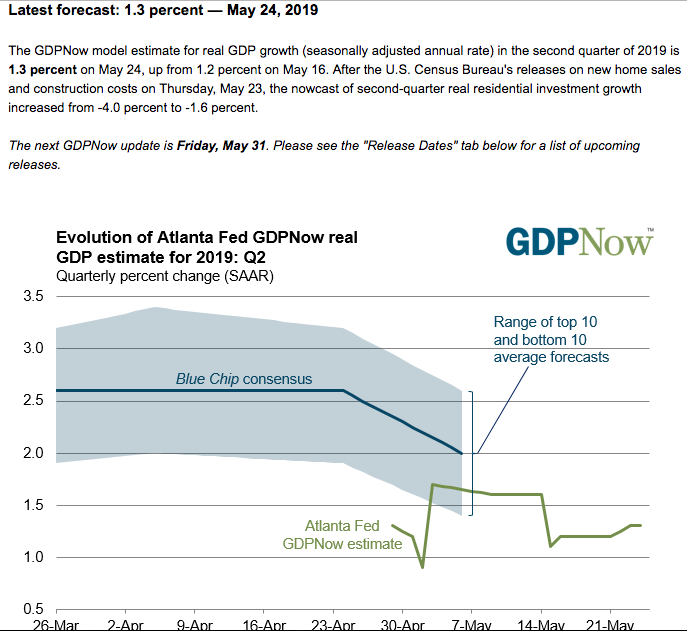
Although J.P. Morgan has lowered their Q2 GDP expectations to a more reasonable level, the Atlanta Fed GDPNow forecast was lifted last week from 1.2% to 1.3 percent.
In addition to J.P. Morgan and the Atlanta Fed’s latest revisions to their respective Q2 GDP outlook we offer the following key, Q2 GDP revisions:
- From Merrill Lynch: We lowered 2Q GDP tracking by 0.2pp to 1.6%, while 1Q remained unchanged at 2.9%
- From Goldman Sachs: We lowered our Q2 GDP tracking estimate by two tenths to +1.3% and our past-quarter GDP tracking estimate for Q1 by one-tenth to +3.0% (qoq ar).
- From the NY Fed Nowcasting Report: The New York Fed Staff Nowcast stands at 1.4% for 2019:Q2. News from this week's data releases decreased the nowcast for 2019:Q2 by 0.4 percentage point. Negative surprises from the Advance Durable Goods Report drove most of the decrease.
Showing signs of bucking the trend with regards to the trade feud’s impact on U.S. equities if not U.S. economic growth, Strategas offered the following commentary and supportive chart:
“One might wonder why we are not more bearish short-term .. and it’s because the US equity market is the safe haven trade. .. Think of it this way, global equity managers and macro funds, to the extent they have any equity exposure, will Overweight the US.”
The economic calendar is rather light this week and found with highlights surrounding housing sector data releases as well as a 2nd look at Q1 GDP, which is expected to be revised slightly lower than the initial reading of 3.2 percent.
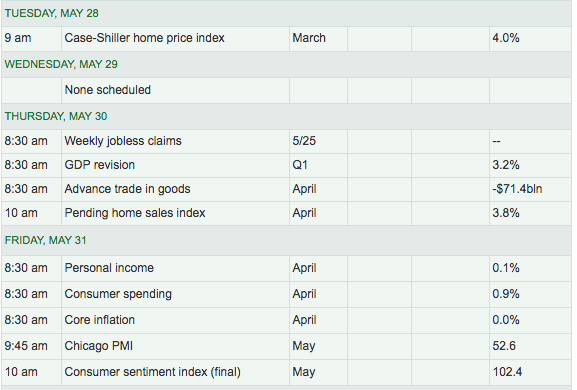
To round out the week, investors will achieve the latest Personal Consumption and Expenditures (PCE) data.
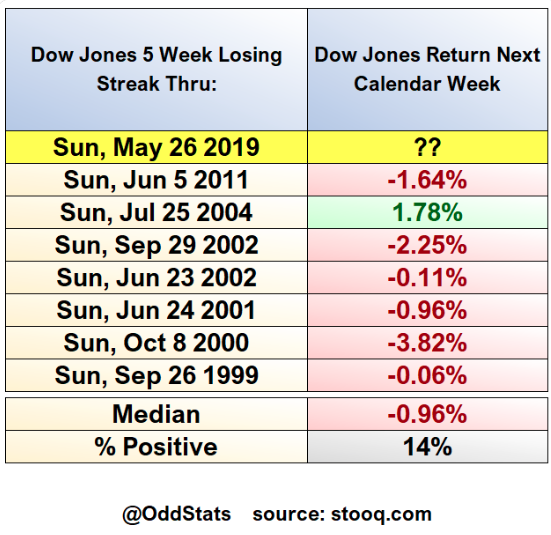
By now you’ve probably recognized that the Dow Jones Industrial Average (DJIA) has finished lower for 5 consecutive weeks. This is the 8th time the Dow has reached 5 weeks in a losing streak over the past 20 years. If history is any guide, the probability of another weekly decline is elevated.
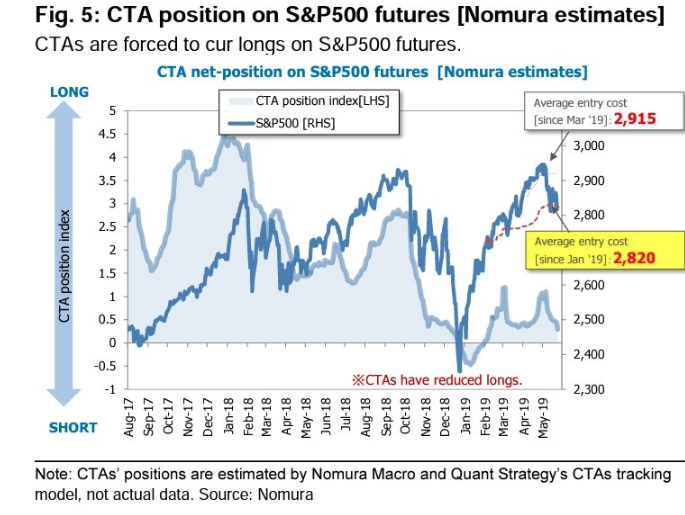
Analysts are making valiant efforts in forecasting the future rate of economic growth and the impact of trade feuds on corporate earnings. In the near-term, the tug of war between risk on and risk off may continue to reign supreme, unless a break of S&P 500 2,800 is achieved on closing basis. Nomura’s strategist suggest that a sustained breach of 2,820 will find S&P futures under pressure as CTA’s are forced to sell and potentially buy volatility.
Speaking of volatility, an interesting scenario developed over the last 2 weeks. The VIX and the S&P 500 have fallen together over the past 2 weeks. This is pretty rare given that the VIX and the S&P 500 tend to move inversely to each other.
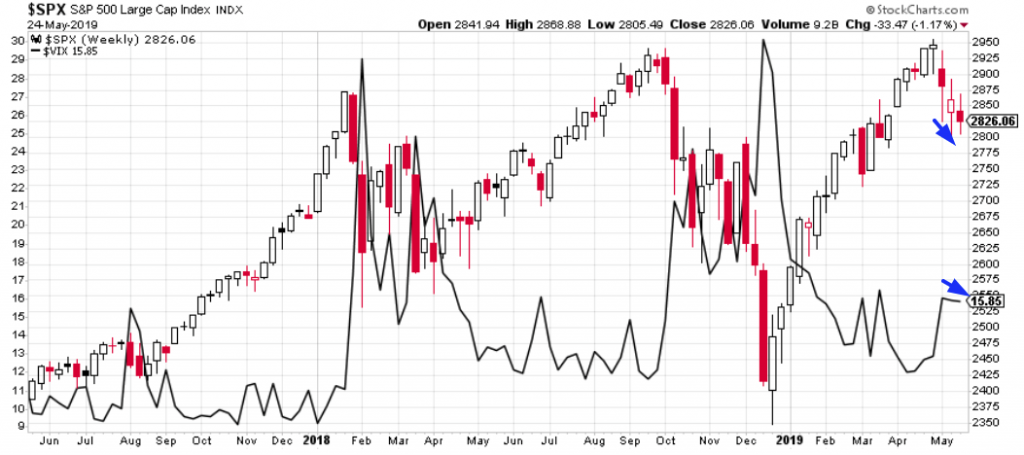
Keeping in mind the VIX’s move lower has not been significant, we aim to see which market is right. Is the VIX signaling we should expect less volatility in June and greater S&P 500 returns in the coming month; or is the VIX just late to the party and found for the long positioning that had been accumulated and heavily underwater dissipating, capping VIX spikes and producing more docile markets even in the face of S&P 500 declines?
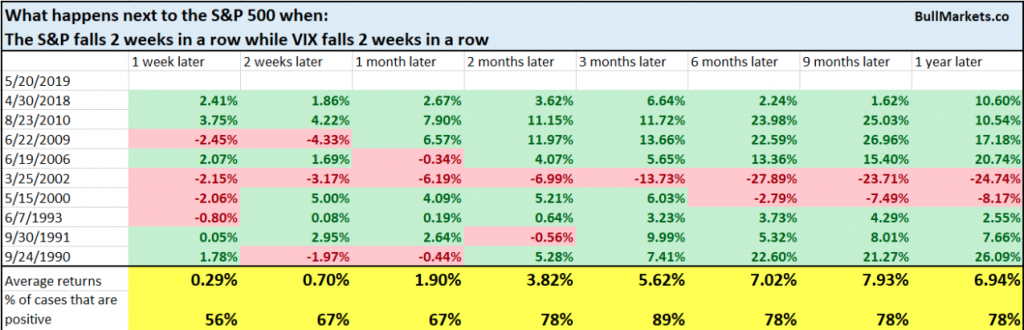
According to the historic study provided by Bullmarkets.co, the occurrence is mostly bullish going forward. What we’d also suggest is the unique scenario that has taken shape in the 2 indexes over the last 2 weeks has been headline driven and identifies how fluid markets have become with trade headlines breaking almost daily.
For the current trading week, the market is looking for a lesser weekly expected move than the prior trading week at roughly $48/points. The S&P 500 finished lower by 1.2% last week and has logged losses for 3 consecutive weeks. While trade headlines continue to loom largely with investor sentiment, we should also recognize that last week actually found net inflows into equity ETFs.
The ETF universe had net inflows of $5.3 billion last week as all three asset groups took in net new money. Equity ETFs (+$5.0 billion) were responsible for the lion’s share of the net inflows, while taxable bond and muni bond ETFs accounted for $226 million and $79 million, respectively, of the total net inflows. The largest individual net inflows among equity ETFs belonged to SPDR S&P 500 ETF (SPY, +$2.1 billion) and iShares Core S&P 500 ETF (IVV, +$892 million)
On the heels of a strong performance put in by Asian equity markets, the U.S. equity futures market is bucking the fears indicated by outsized U.S. Treasury buying activity in the 7:00 a.m. EST hour. This may also be an offshoot of the rebound in the price for crude oil this morning.
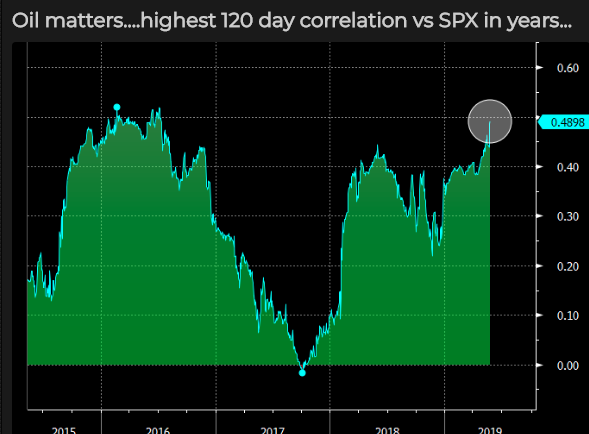
As depicted in the chart above, crude oil has recently had its highest correlation to the S&P 500 in recent years. Investors and economists believe the demand side of the crude oil price stability equation is a sign of solid global economic conditions. To this extent, stronger crude oil prices tend to correlate in favor of risky assets i.e. equities. We’ll see if the premarket set-up carries forward throughout the trading day.


