
S&P 500's Downward Reversal Or Just Profit-Taking Action?
The U.S. stock market indexes were mixed between -0.2% and 0.0% on Wednesday, as investors took short-term profits off the table following the recent rally. The S&P 500 index retraced more of its October-December downward correction of 20.2% yesterday before reversing its intraday upward course. Last Friday it broke above the 2,900 level. The broad stock market's gauge is now just 1.4% below September the 21st record high of 2,940.91. The Dow Jones Industrial Average was unchanged and the Nasdaq Composite lost 0.1% on Wednesday.
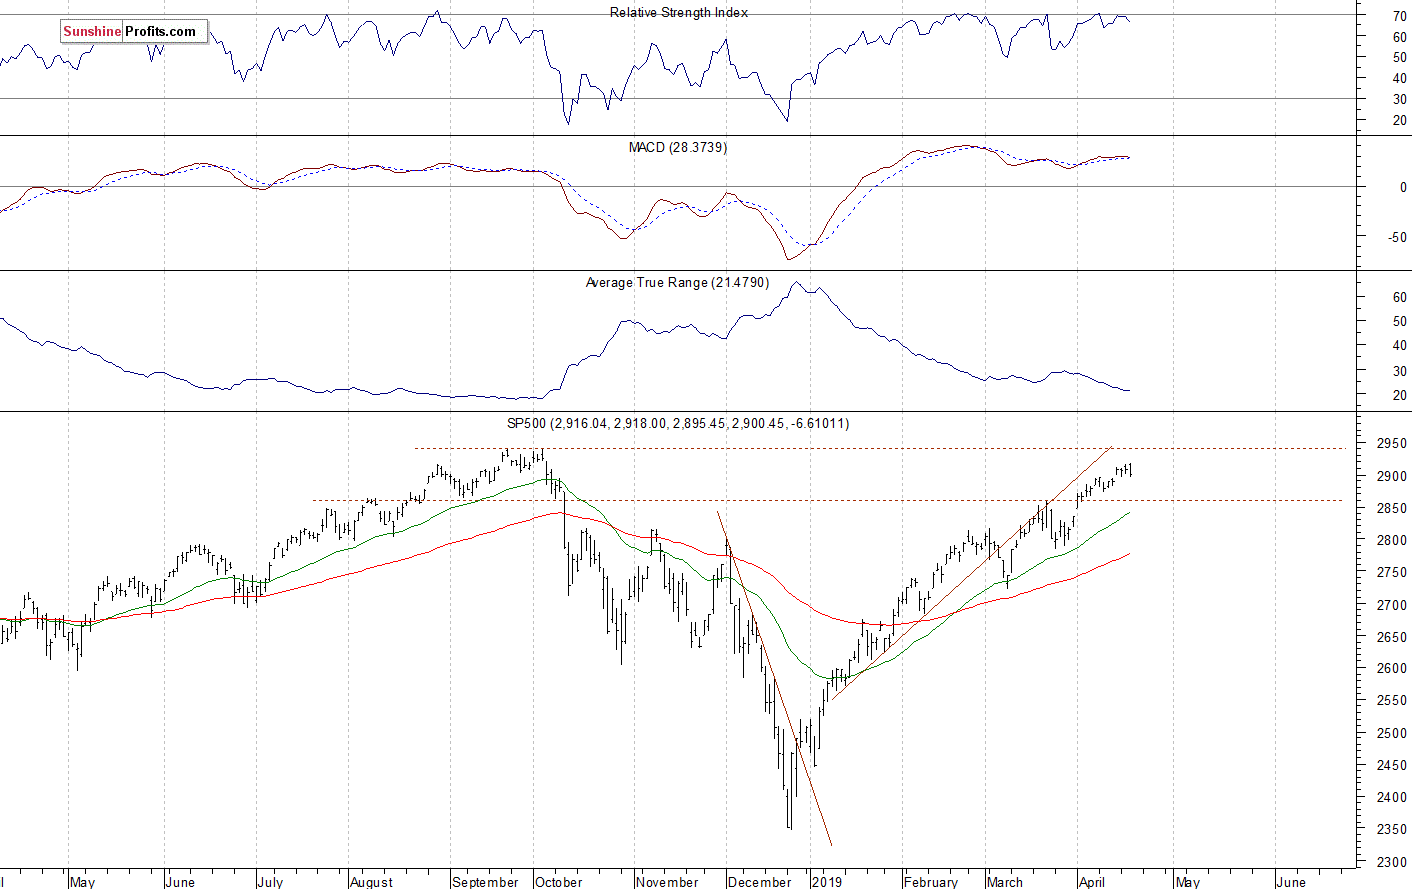
The nearest important resistance level of the S&P 500 index remains at 2,920-2,940, marked by the mentioned record high, among others. On the other hand, the support level is at 2,900, marked by the recent resistance level. The support level is also at 2,860-2,865, marked by the recent local lows.
The broad stock market retraced all of its December sell-off and it broke above the medium-term resistance level of around 2,900 last week. So is it still just a correction or a new medium-term uptrend? We may see an attempt at getting back to the record high. There have been no confirmed negative medium-term signals so far. The index got closer to its last October all-time high, as we can see on the daily chart:
Short-Term Consolidation
Expectations before the opening of today's trading session are virtually flat because the index futures contracts trade 0.1% below their Wednesday's closing prices. The European stock market indexes have been mixed so far. Investors will wait for series of economic data announcements today: Retail Sales, Philly Fed Manufacturing Index, Unemployment Claims at 8:30 a.m., Flash Manufacturing PMI, Flash Services PMI at 9:45 a.m., Business Inventories, CB Leading Index at 10:00 a.m. They will also wait for more quarterly corporate earnings releases. Stocks will likely continue to fluctuate along the local highs today. There have been no confirmed negative signals so far. However, we could see some more uncertainty as the broad stock market's gauge gets closer to the mentioned September's record high.
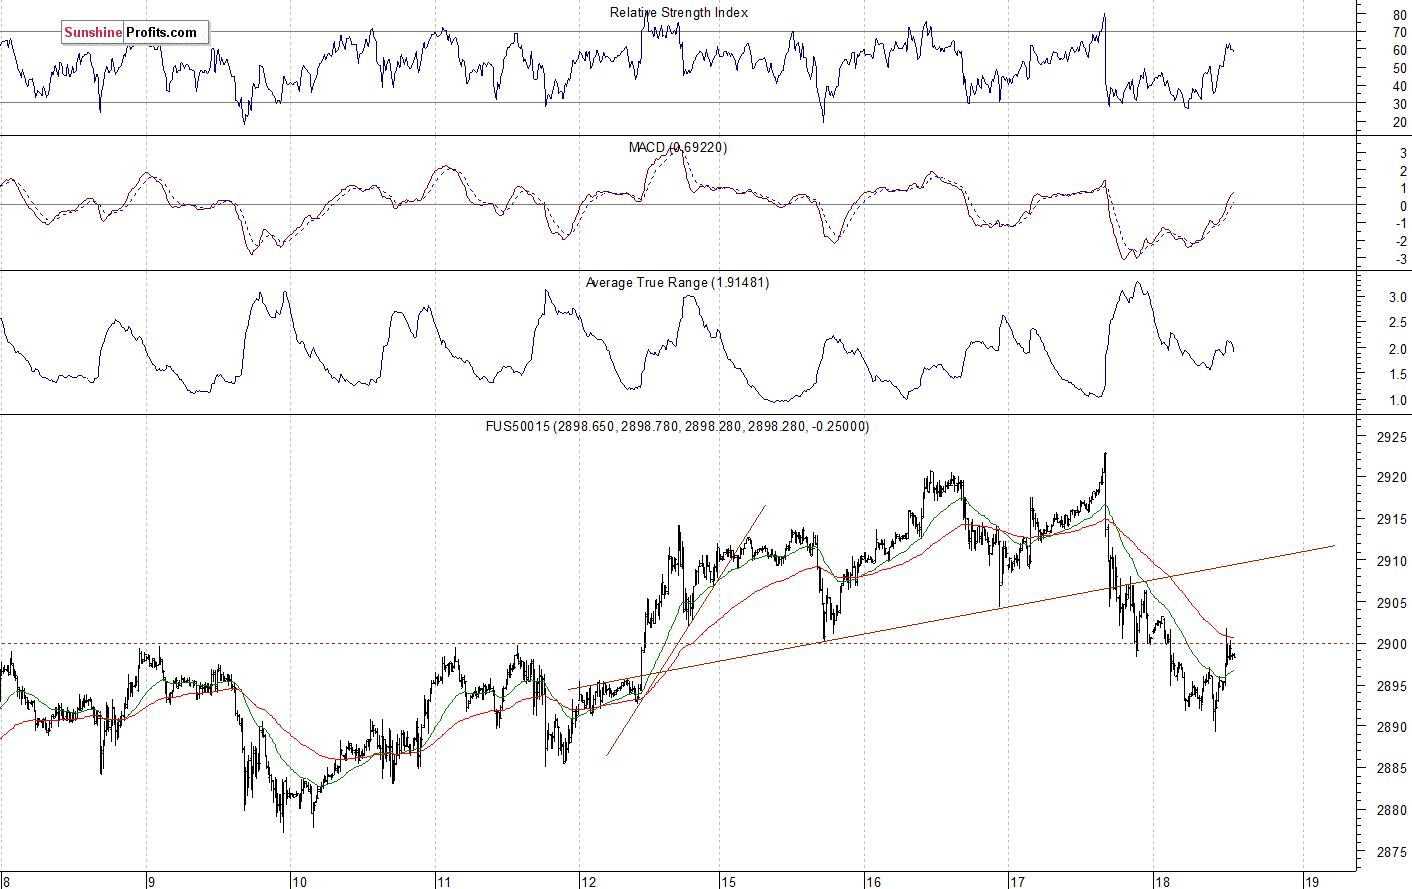
The S&P 500 futures contract trades within an intraday uptrend, as it retraces some of its overnight decline. The nearest important resistance level is at around 2,900-2,910. On the other hand, the support level is at 2,890, marked by the local low. The futures contract trades along its previous local highs, as the 15-minute chart shows:
Nasdaq Slightly Below 7,700 Mark
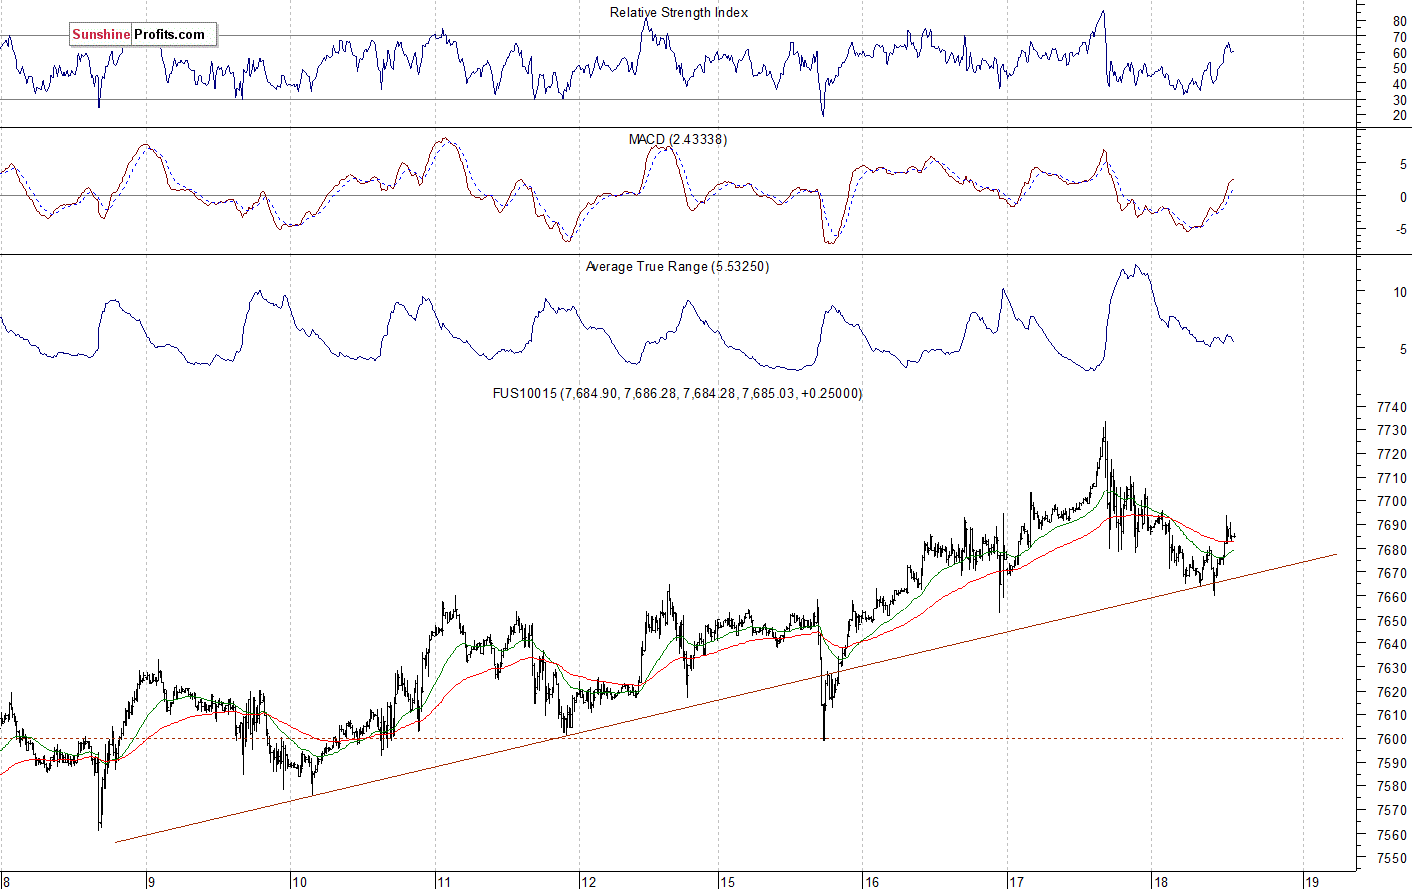
The technology Nasdaq 100 futures contract follows a similar path, as it trades within an intraday uptrend. The market retraces some of its overnight decline. The nearest important resistance level is at around 7,700-7,750. On the other hand, the support level is at 7,600-7,650. The Nasdaq futures contract remains close to the short-term upward trend line, as we can see on the 15-minute chart:
Microsoft at New Record High Again, Apple Above $200
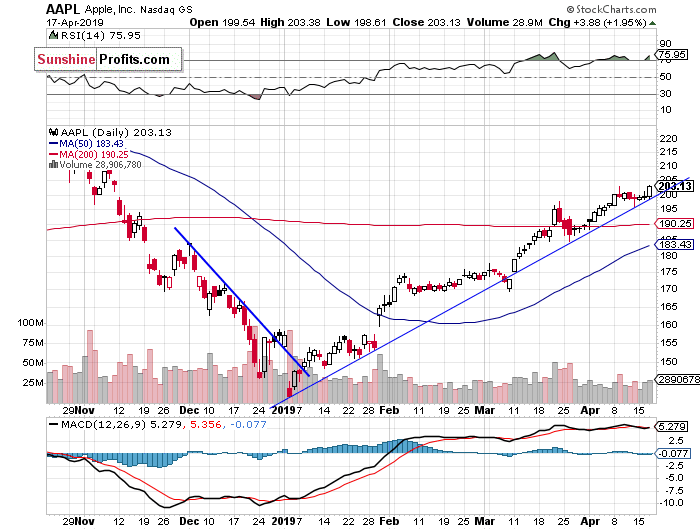
Let's take a look at the Apple, Inc. stock (AAPL) daily chart (chart courtesy of StockCharts). The stock accelerated its uptrend recently and it got close to the $200 level. Yesterday the market bounced off its upward trend line and reached the new medium-term high:
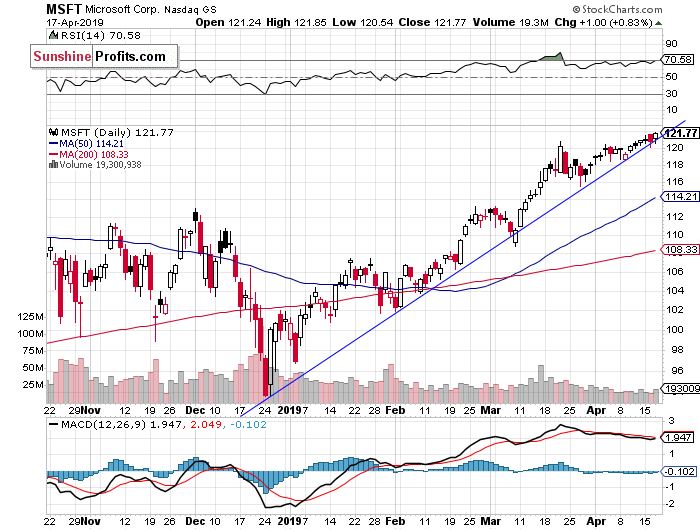
Now let's take a look at the daily chart of Microsoft Corp. (MSFT). The stock reached yet another new record high yesterday. The market continues to trade along the three-month-long upward trend line:
Dow Jones Going Sideways
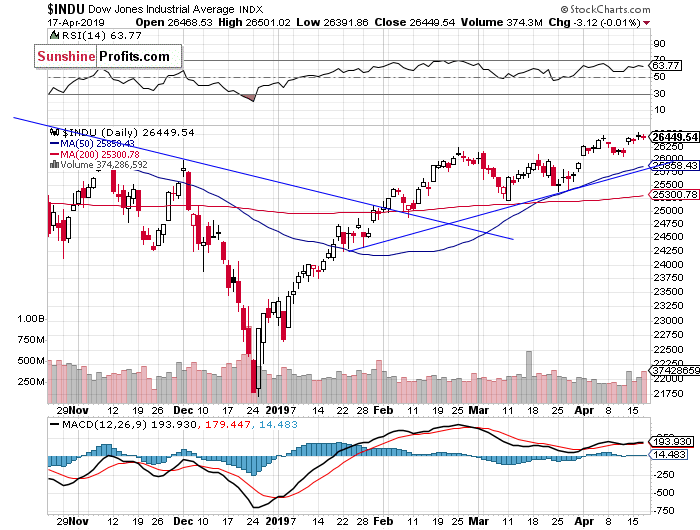
The Dow Jones Industrial Average broke above its February local high recently and it extended the medium-term uptrend. The next resistance level is at around 26,800-27,000, marked by the last year's topping pattern and the record high of 26,951.8. Yesterday the blue-chip stocks' gauge reached a new medium-term high. There have been no confirmed negative signals so far. However, we can see some negative technical divergences:
Nikkei - Uncertainty Following Monday's Rally
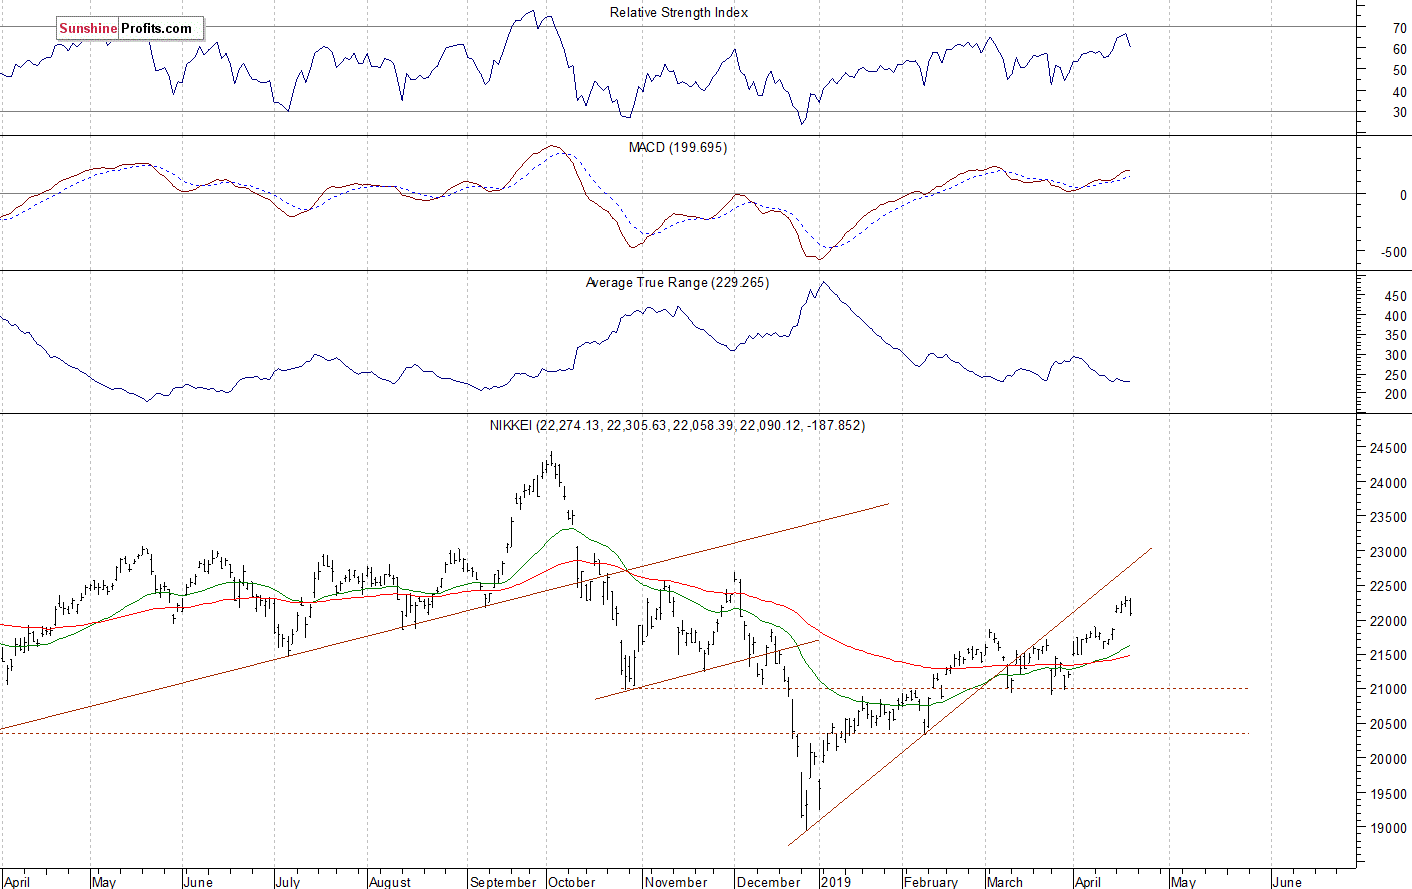
Let's take a look at the Japanese Nikkei 225 index. It accelerated the downtrend in late December, as it fell slightly below the 19,000 level. Then it was retracing the downtrend for two months. In March the market went sideways. Recently the index got close to 21,500-22,000 again. And on Monday it broke above the 22,000 mark:
The S&P 500 index extended its medium-term uptrend yesterday, as it got the highest since the early October. Then the broad stock market retraced some of its recent advance, as investors took short-term profits off the table. We previously wrote that it looked like a flat correction within an uptrend. And it did. But will the market reach the September's record high? We may see some profit-taking action, as stocks trade closer to their resistance levels.
Concluding, the S&P 500 index will likely open virtually flat today. We may see some more uncertainty, as the broad stock market trades closer to its September's record high. Investors will await economic data and quarterly corporate earnings releases.
Disclosure: None.


