
S&P 500 Remains Below 2,900 Mark, Will Downtrend Continue?
The U.S. stock market indexes were mixed between -0.3% and 0.0% on Wednesday, as investors hesitated following Tuesday's sell-off. The S&P 500 index retraced its April's advance. It currently trades 2.5% below its May the 1st record high of 2,954.13. The Dow Jones Industrial Average was unchanged and the Nasdaq Composite lost 0.3% on Wednesday.
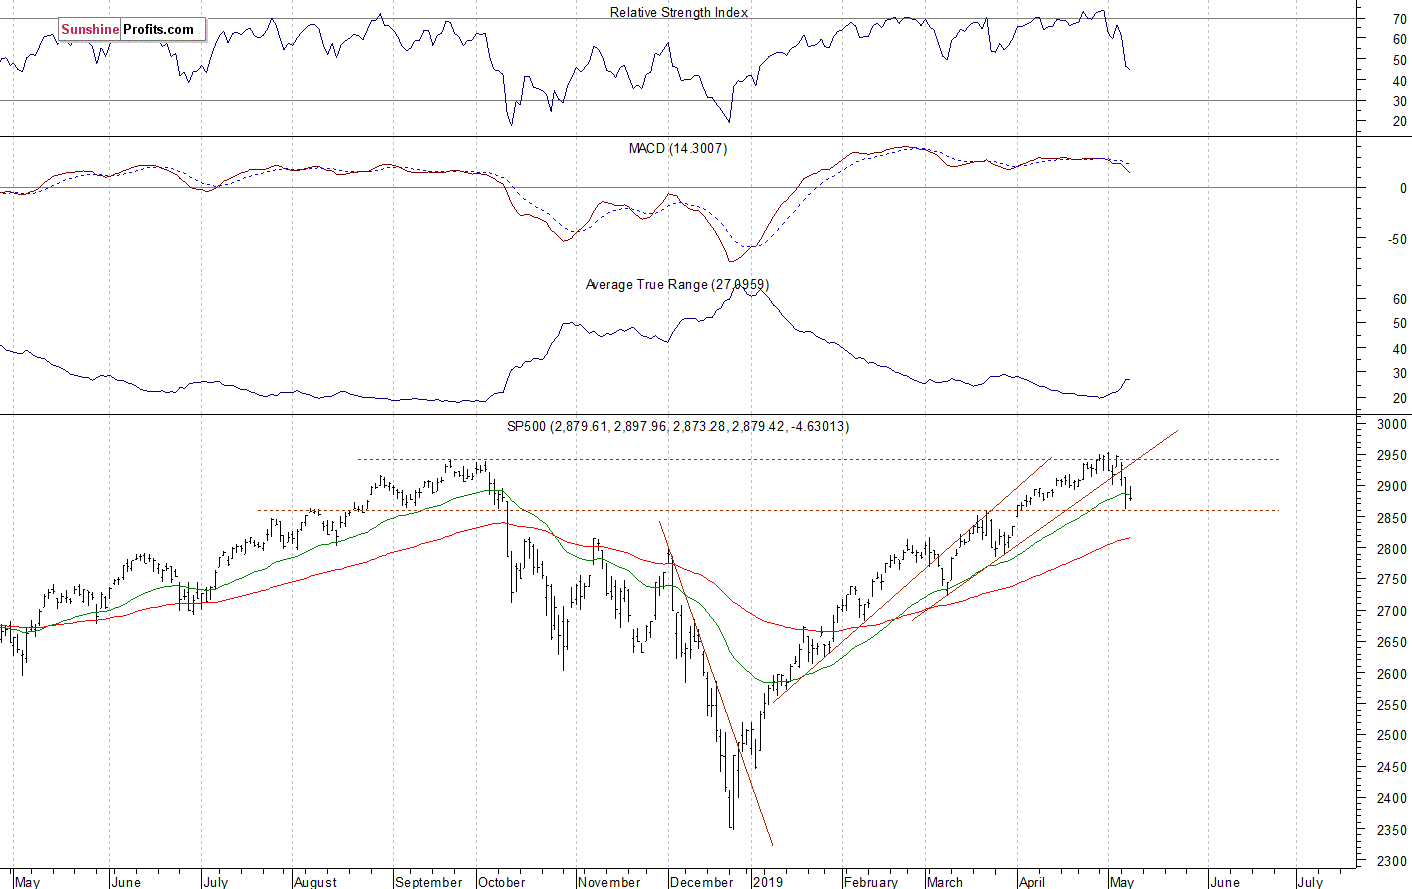
The nearest important resistance level of the S&P 500 index remains at 2,890-2,900, marked by the recent support level. The resistance level is also at 2,920. On the other hand, the support level is at 2,860-2,865. The support level is also at around 2,835-2,850, marked by April the 1st daily gap up of 2,836.03-2,848.63.
The broad stock market retraced all of its December sell-off and it broke above the last year's high recently. But on Tuesday the index broke below the short-term consolidation and it retraced all of the April's advance. The market also broke below its two-month-long upward trend line, as we can see on the daily chart:
Negative Expectations Again, S&P 500 Futures at New Low
Expectations before the opening of today's trading session are negative because the index futures contracts trade 0.6-0.8% below their Wednesday's closing prices. The European stock market indexes have lost 0.3-1.1% so far. Investors will wait for some economic data announcements today: Producer Price Index, Trade Balance, Unemployment Claims at 8:30 a.m., Wholesale Inventories at 10:00 a.m. There will also be a speech from the Fed Chair Powell at 8:30 a.m.
The broad stock market will likely extend its short-term fluctuations along the local lows today. For now, it looks like a downward correction. The index broke below the support level of around 2,890-2,900 on Tuesday, and then we saw more selling pressure. Will the market break below the relatively important support level of 2,850? There have been no confirmed positive signals so far.
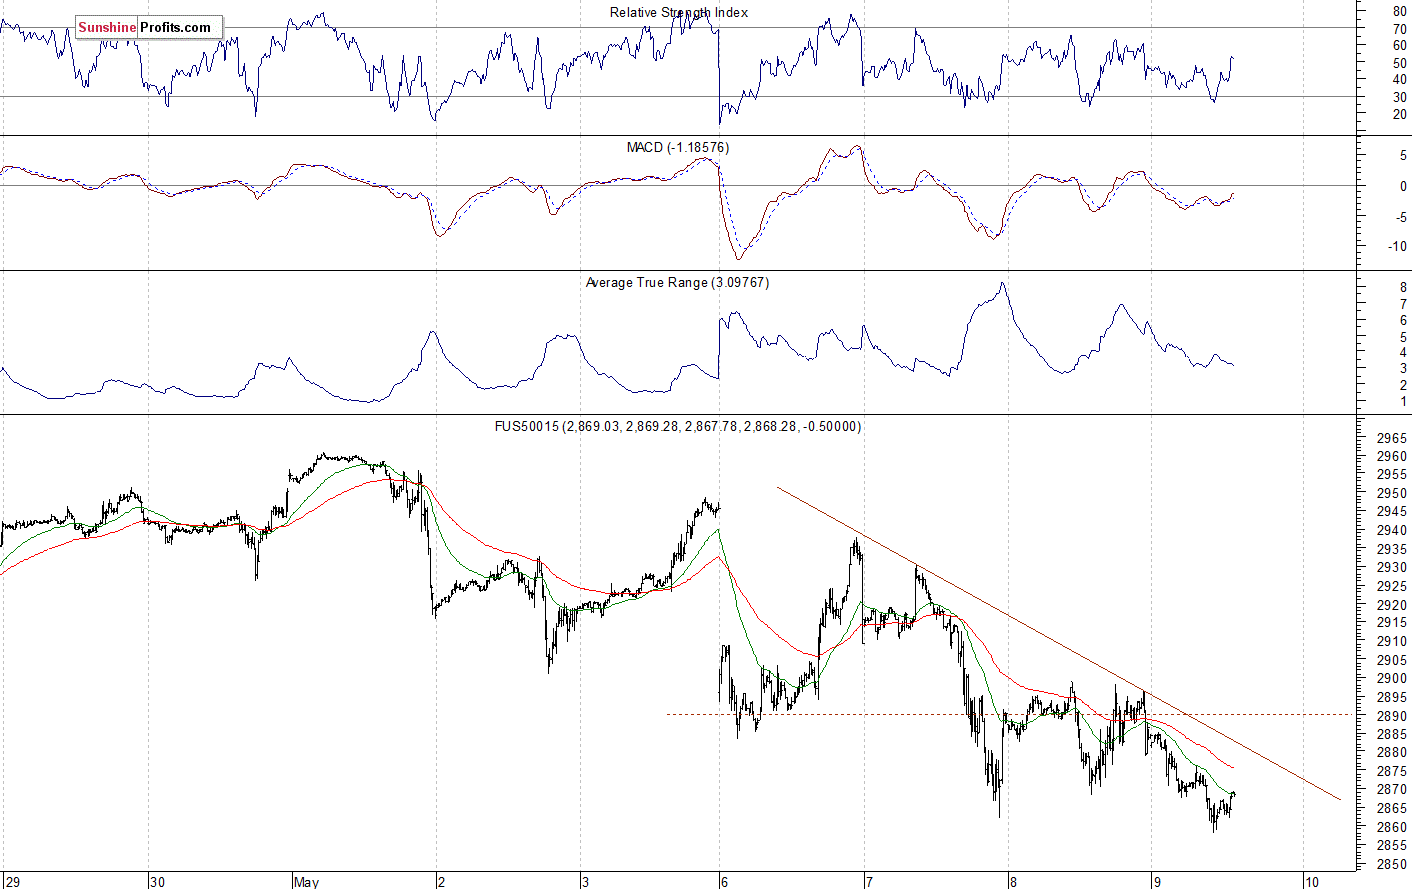
The S&P 500 futures contract trades within an intraday consolidation following an overnight decline. The nearest important level of resistance is at around 2,890-2,900. On the other hand, the support level is at 2,850-2,860. The futures contract remains below its short-term downward trend line, as the 15-minute chart shows:
Nasdaq Also Lower
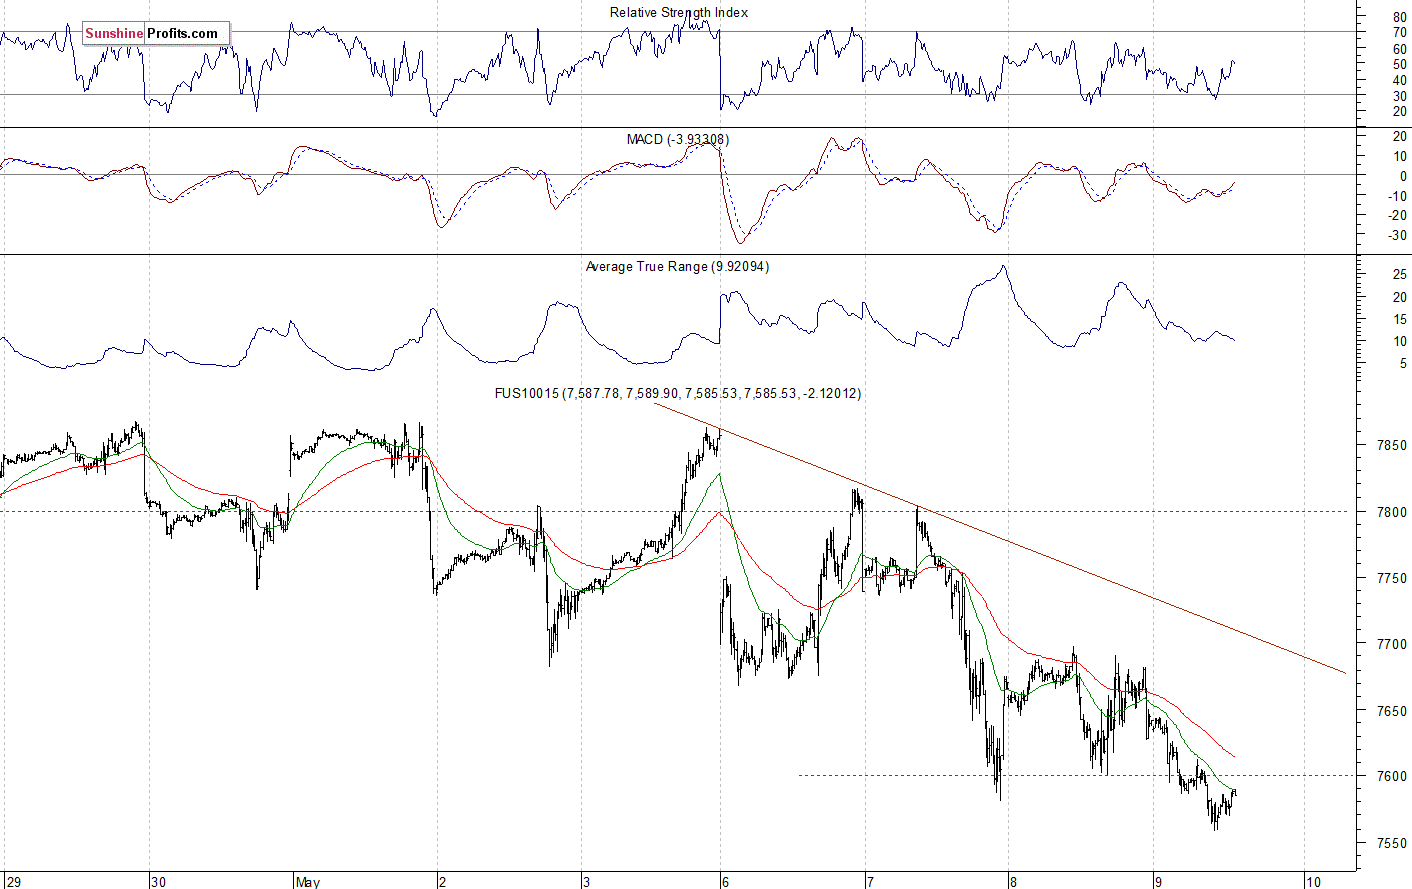
The technology Nasdaq 100 futures contract follows a similar path, as it trades within an intraday consolidation after extending its short-term downtrend. The nearest important resistance level is now at 7,600-7,650. On the other hand, the support level is at 7,500-7,550. The Nasdaq futures contract is now below the 7,600 mark, as we can see on the 15-minute chart:
Big Cap Tech Stocks - Pause Following the Decline, Bottoming Pattern?
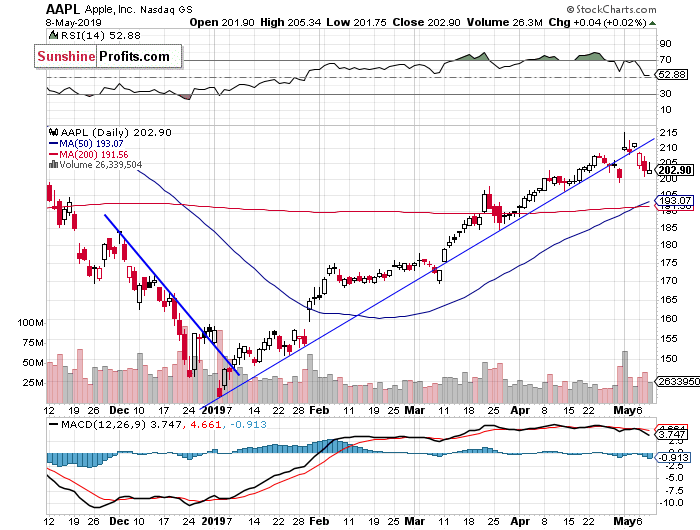
Let's take a look at the Apple, Inc. stock (AAPL) daily chart (chart courtesy of StockCharts). The stock gained almost 5% a week ago on Wednesday, following its quarterly earnings release. The price got back above the broken medium-term upward trend line again. However, last week's Wednesday's intraday trading action was quite bearish. And on Monday the stock got back below the upward trend line. The resistance level remains at around $210-215, and the support level is at $200:
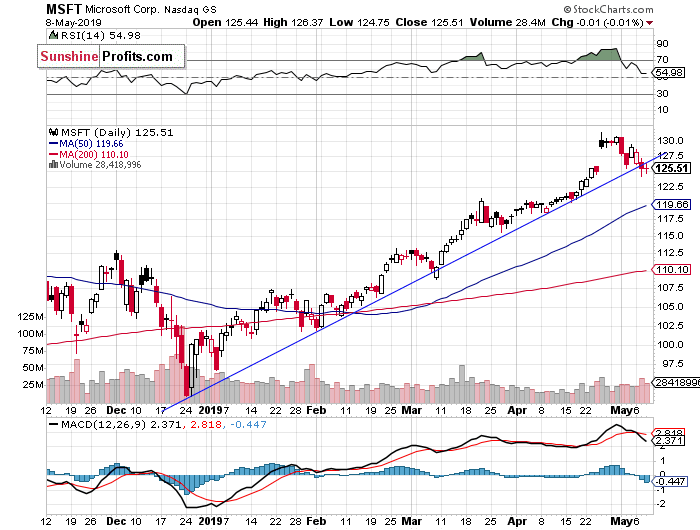
Now let's take a look at the daily chart of Microsoft Corp. (MSFT). The stock accelerated its uptrend recently, as it reached the new record high of $131.37. Investors reacted to a better-than-expected quarterly earnings release. But it looked like a blow-off topping pattern. And we wrote about some clear technical overbought conditions. On Tuesday the stock broke slightly below its medium-term upward trend line:
Dow Jones Going Sideways
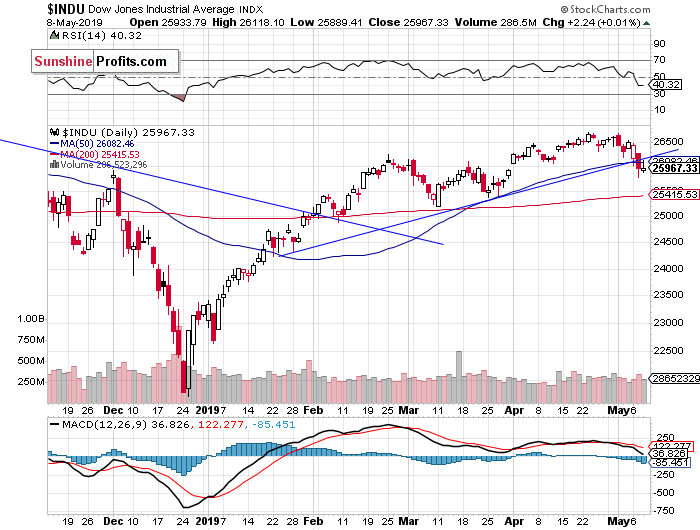
The Dow Jones Industrial Average was relatively weaker than the broad stock market recently. On Tuesday the blue-chip stocks' gauge broke below its medium-term upward trend line. The resistance level remains at around 26,800-27,000, marked by the last year's topping pattern and the record high of 26,951.8:
The S&P 500 index has reached the new record high last week after breaking above the recent local highs. The broad stock market extended its medium-term uptrend, as investors' sentiment remained very bullish following economic data, quarterly corporate earnings releases. However, on Tuesday it retraced its April's advance following the renewed trade war fears. We may see some more short-term volatility, as stocks trade closer to the medium-term support levels.
Concluding, the S&P 500 index will likely open lower today. The market may fluctuate along its local low for some time. If the index breaks below 2,850, we could see more selling pressure.
Disclosure: None.


