
S&P 500, Nasdaq 100 Close To Forming Reversal Candles In Nov.
With two sessions to go, November is on the verge of flashing a yellow flag on both the S&P 500 (SPX, SPY) and Nasdaq 100 (NDX, QQQ). These indices of late have diverged with deteriorating consumer sentiment. In a seasonally favorable period, some key levels are worth a watch.

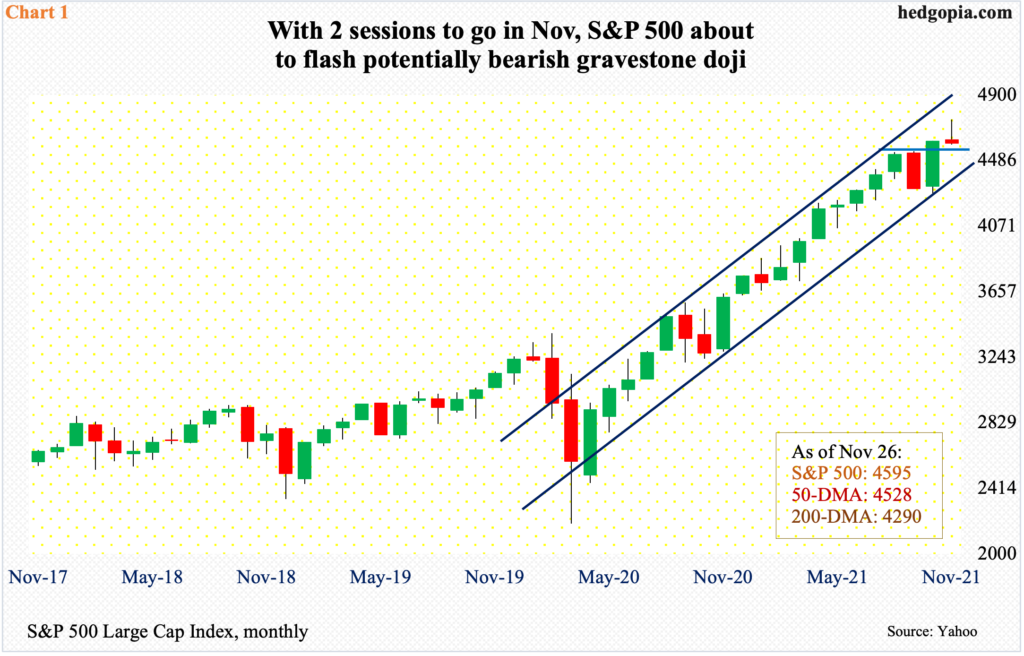
The S&P 500 formed an outside month in September. This was a potentially bearish candle but needed confirmation. October instead ended with a non-confirmation forming a bullish outside month. Come November, which is two sessions from winding down, the large cap index is about to complete a gravestone doji (Chart 1). This candle often shows up just before a bearish reversal, but, once again, it needs confirmation. December, therefore, will be crucial.
Last Friday, the S&P 500 tumbled 2.3 percent to basically change the shape of the monthly candle. Bulls had an opportunity to cash in on a potentially bullish ascending triangle but came up short.
On November 5, the index tagged 4719 intraday in a spinning top session. It then went sideways within a triangle, which it broke out of last Monday but only to reverse sharply lower. From that high (4744), the S&P 500 (4595) is now down 3.1 percent. Not a whole lot in a big scheme of things. From October 4 through last Monday’s high, the index rallied just under 11 percent; the pace was simply unsustainable. Last week’s action could just be a plain-vanilla unwinding of overbought conditions or the beginning of something nasty.
Nearest support lies at 4540s. This will be the first test of bulls’ willingness to defend support. Just underneath lies the 50-day moving average at 4528.
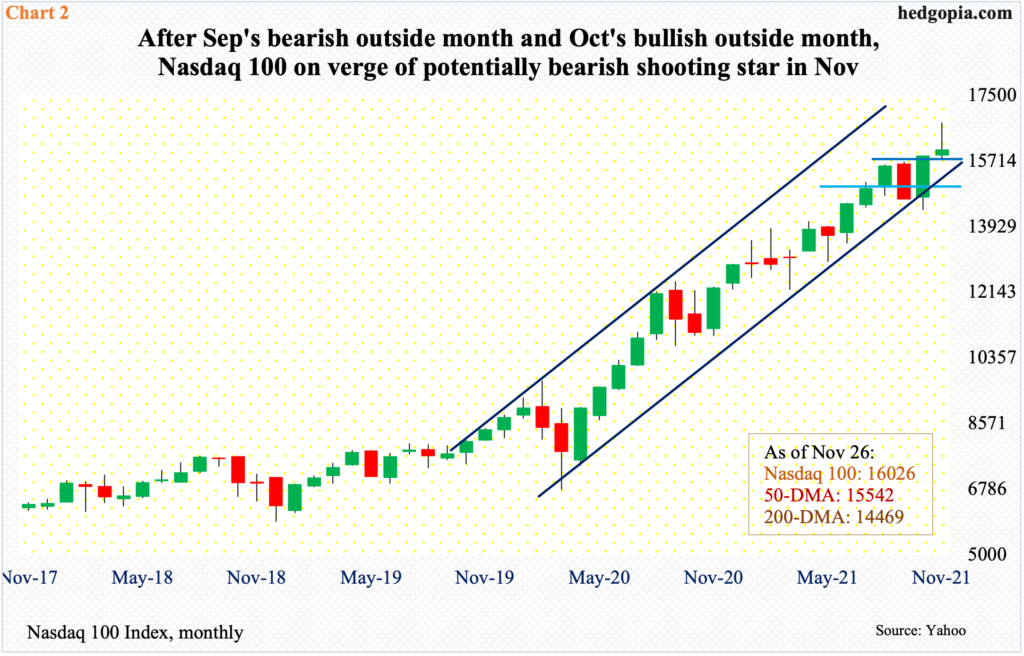
Things have unfolded similarly on the Nasdaq 100. September’s bearish outside month was followed by October’s bullish outside month. October’s momentum continued until November 5 when the tech-heavy index tagged a new intraday high of 16454, before going sideways. The consolidation resolved to the upside last Monday when it posted a new intraday high of 16765 but only to reverse sharply lower.
Last week, the index (16026) suffered an outside week, down 3.3 percent; Friday’s 2.1-percent rout cost it both the 10- and 20-day. With a couple of sessions to go this month, the monthly is on course for a potentially bearish shooting star (Chart 2).
Immediately ahead, there is support at 15700s, and 15100s after that.
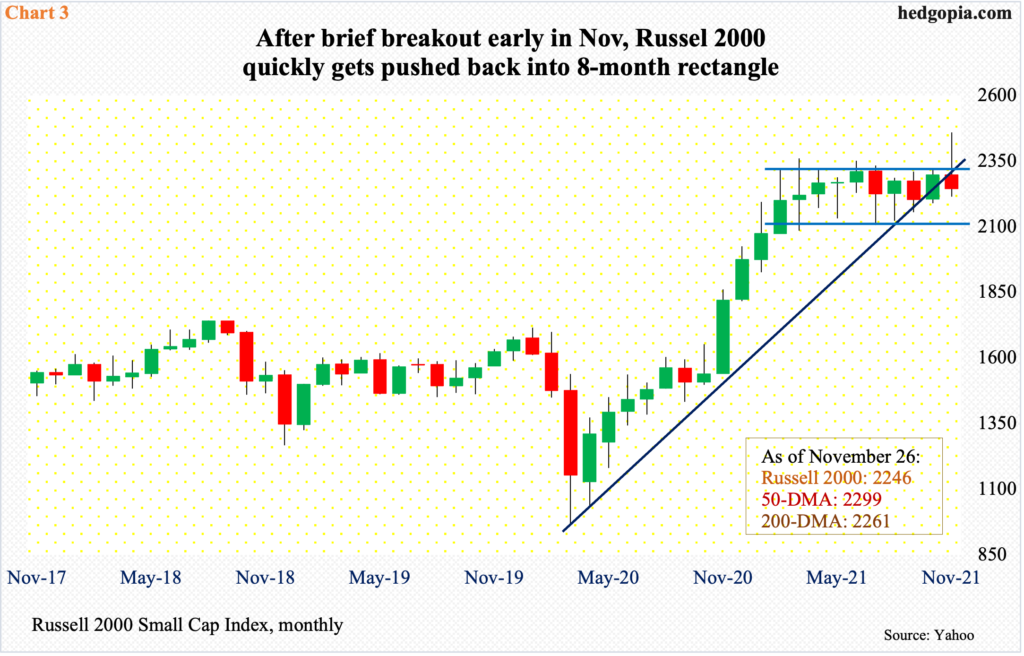
The Russell 2000 (IWM), too, posted a new high this month but bulls were unable to hang on to it, with November-to-date forming a shooting star (Chart 3). On the 8th, the small cap index rallied to 2459. Earlier on the 3rd, it powerfully broke out of an eight-month rectangle.
Since March this year, the Russell 2000 had been rangebound between 2350s and 2080s, and between 2280s and 2150s within this rectangle. If the breakout was genuine, technicians would in due course be eyeing 2600.
The record high on the 8th came in a shooting star session, which preceded a sustained drop. A breakout retest took place on the 19th and it failed. Last Friday’s 3.7-percent tumble also cost the Russell 2000 (2246) 2280s support. The index currently sits right at 2250s support, hence this is an opportunity for small-cap bulls to step up and defend. A decisive loss of this should open the door toward 2150s, and 2080s in a worse-case scenario.
Major equity indices are not that far off from record highs, but they are beginning to act tentative – as if searching for direction – even as the Fed is tapering its bond purchases. The central bank is sitting on $8.68 trillion in assets, up from $4.24 trillion in early March last year, and is reducing its monthly $120-billion bond purchases by $15 billion a month. The bond-buying program is set to unwind by June next year, and by that time the balance sheet likely crosses $9 trillion.
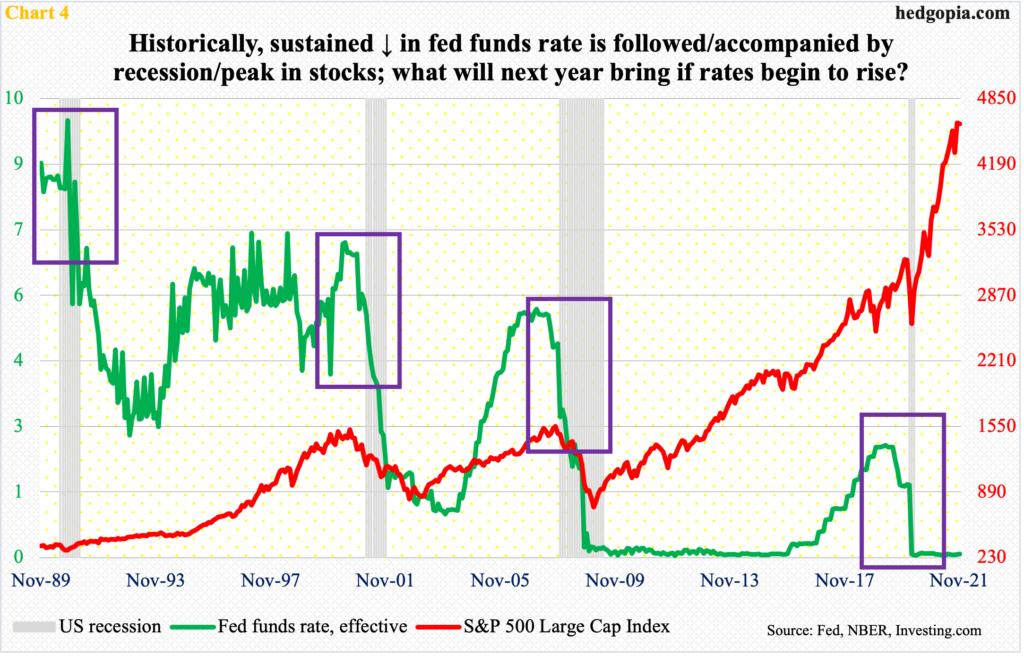
Markets are betting that the Fed then begins to raise rates. The fed funds rate currently sits in a range of zero to 25 basis points. Futures traders have priced in up to three 25-basis-point hikes by December next year.
Here is the thing. Historically, a sustained drop in the fed funds rate has been followed or accompanied by economic contraction. We saw this unfold during last year’s COVID recession as well.
Using this playbook, if rates indeed head higher in the second half next year, then stocks’ path of least resistance should be higher.
Unless inflation gets out of control and the Fed is forced to tighten in an aggressive manner, markets are currently priced in for deceleration, but continuation, of this year’s momentum – in the economy, in corporate earnings, and what not.
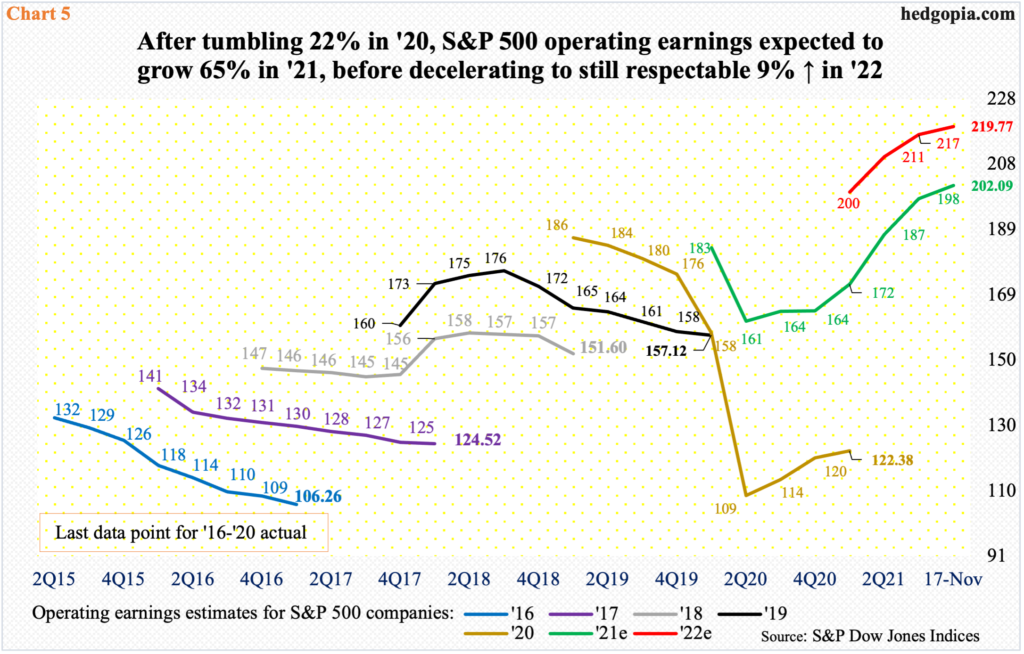
With 3Q results just about complete, S&P 500 companies are expected to earn $202.09 in operations this year, up 65.1 percent from last year’s COVID-suppressed $122.38. Next year, growth is expected to massively decelerate, but still grow a respectable nine percent, to $219.77 (Chart 5).
This optimism, among others, is what is behind the 22.3-percent jump in the S&P 500 so far this year. This, on the other hand, is exactly the issue – that stocks have moved and that they have moved in divergence with several metrics, one of which is consumer sentiment.
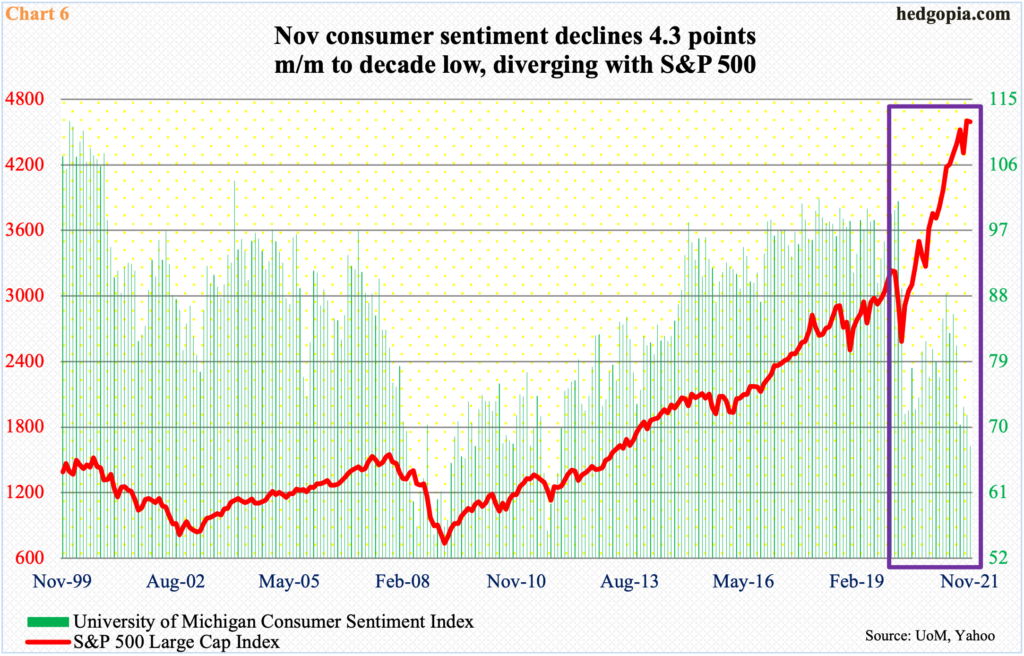
The University of Michigan’s Consumer Sentiment Index in November dropped 4.3 points month-over-month to 67.4 – a decade low and past, of course, the post-pandemic low of 71.8 from April last year and 70.3 from this August. In the past, consumer sentiment and the S&P 500 have shown a tendency to move together – at least directionally.
This time around, the two have diverged (box in Chart 6). One of the reasons for suppressed sentiment is the ongoing jump in inflation. The University’s expected change in inflation rates in November rose to 4.9 for this year and three for next; these are the highest readings since July 2008 and March 2011 respectively.
It is a tricky situation. The divergence is caused possibly because of equity bulls’ expectation that inflation will not sustain at the current pace. Even if that turns out to be true, the fact remains that stocks are currently priced for the best outcome possible. If November indeed ends with bearish candles in the three indices above, it is December’s job to confirm or not confirm the signal.
Thanks for reading!


