
S&P 500 Itching To Break Out At 3950s
Indices are beginning to diverge. Last week, large- and small-caps posted new highs, but tech struggled to put its act together. This is taking place at a time when sentiment is no longer as effusive as several weeks ago. If bulls regroup and sentiment brightens up again, the divergence can continue – for now.
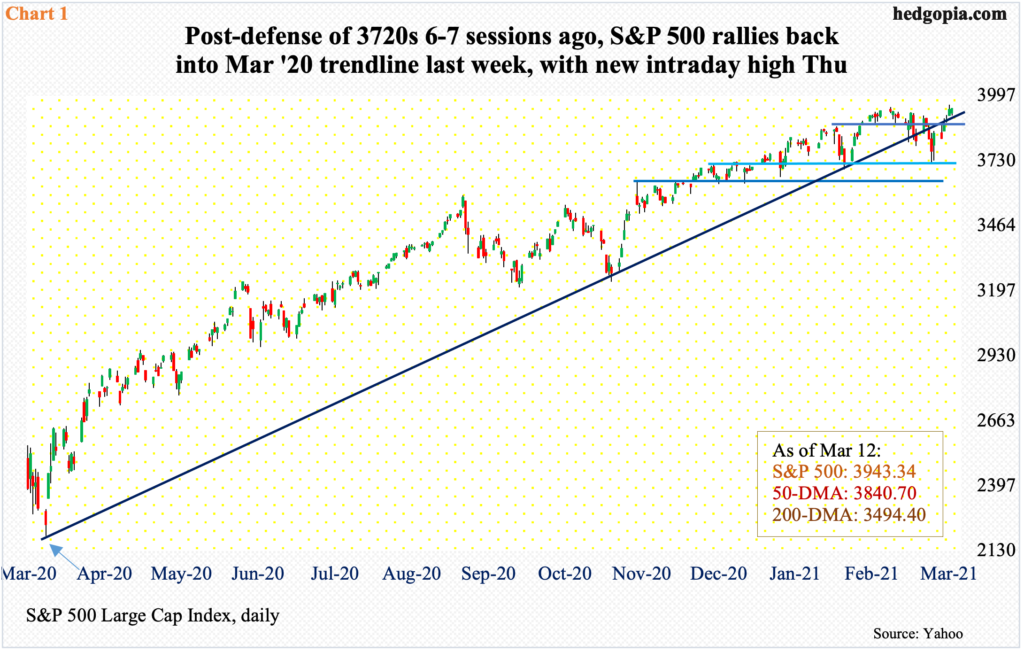
The S&P 500 (SPX) is itching to break out. Last week, the large cap index jumped 2.6 percent. In the prior two weeks, it finished right on a rising trend line from last March; an intraday breach was bought on both March 4 and 5 (Chart 1).
Through the low of 3723.34 on March 4, the S&P 500 shed 5.6 percent. Earlier on February 16, it peaked on 3950.43. From that low, it then quickly rallied 6.4 percent. What was lost in 13 sessions intraday was gained back in seven.
Last Thursday, the index tagged 3960.27 before pulling back slightly. Volume is progressively lower in the latest rally. That said, a decisive break of 3950s can act as a self-fulfilling prophecy, driving the S&P 500 (3943.34) toward the big round number 4000.
Immediately ahead, there is support at 3870s, followed by 3720s; the latter was aggressively defended in the latest selloff.
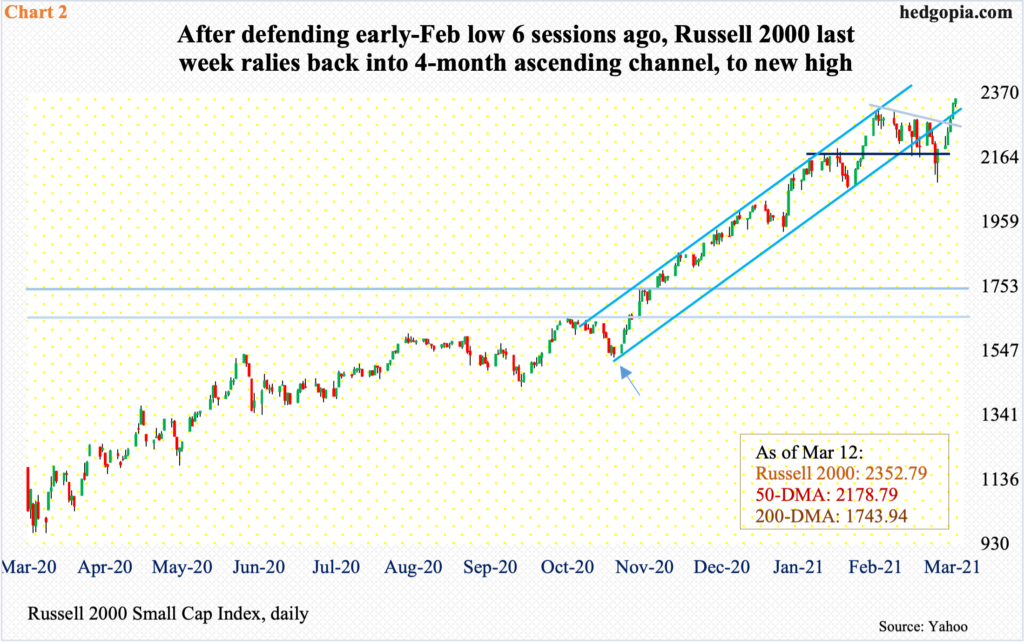
Small-caps went toe to toe with large-caps. In 17 sessions between the February 10th high of 2318.09 and the March 5th low of 2085.12, the Russell 2000 (IWM) dropped 10.1 percent – a correction territory. From that low through last Friday’s high of 2354.20, it then shot up 12.9 percent – in six sessions – to a new high.
Last week, the Russell 2000 (2352.79) jumped 7.3 percent, rallying back into an ascending channel from last October-November (Chart 2). If the index ends up testing the upper bound, as has happened several times the past four months, it is headed higher.
Investors continue to show love for small-caps. Rather strangely, they concurrently bid up the Dow Industrials (DIA), which posted a new record high earlier than both the Russell 2000 and the S&P 500.
No such luck for tech.
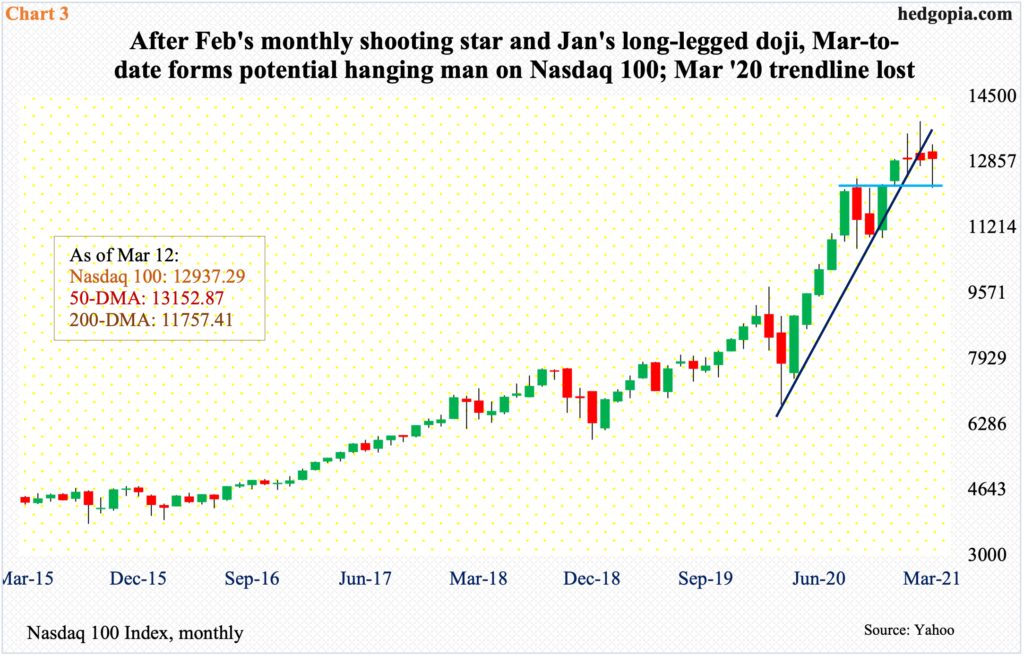
Between February 16 and March 5 intraday, the Nasdaq 100 declined 12 percent – once again, a correction territory. This preceded a 105-percent surge since the low of last March. A trend line from that low was breached three weeks ago and has not been recaptured.
From the low six sessions ago, the Nasdaq 100 is up 4.8 percent. In fact, through Thursday’s high, it rallied as much as 7.4 percent but was rejected at the 50-day moving average. Unlike its peers which have rallied to new highs, the index (12937.29) remains 7.3 percent below its record high from February 16.
With two weeks in, March so far has formed a potential hanging man. This follows February’s monthly shooting star and January’s long-legged doji (Chart 3). Of the major US equity indices, the Nasdaq 100 (NDX) is proving to be a major laggard.
It is possible this is impacting sentiment.
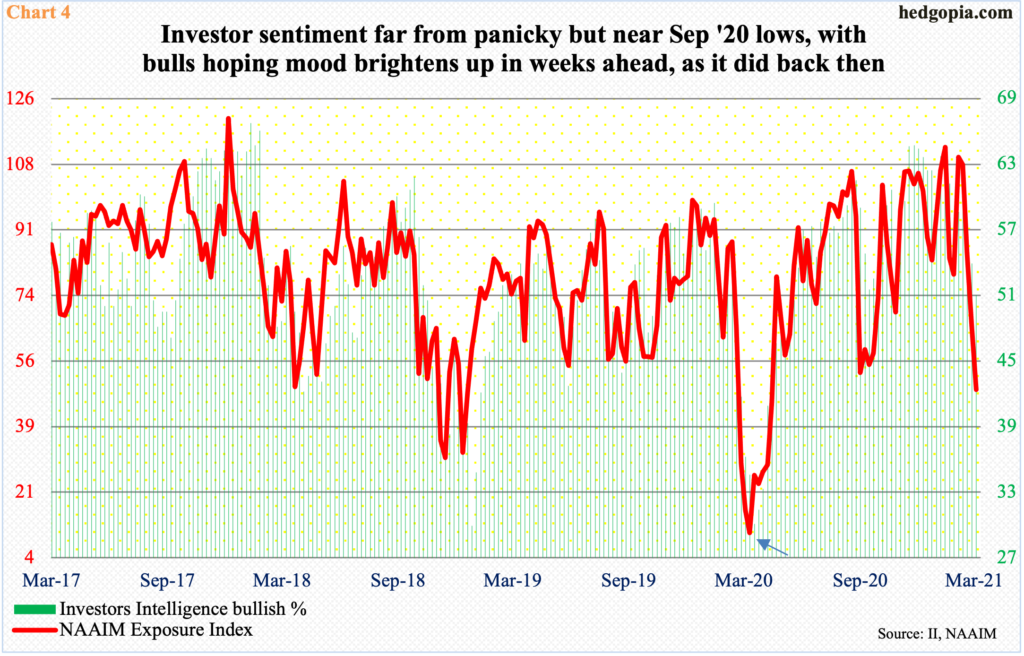
The Nasdaq 100 and the S&P 500 peaked on February 16, and the Russell 2000 on February 10. In the week to February 17, the NAAIM (National Association of Active Investment Managers) Exposure Index posted a reading of 108.3. This is super-bullish territory. In its nearly 15-year history, there have been 29 100-plus readings, 14 of which have occurred since last August. Then in the next three weeks, the index, which measures’ members exposure to US stocks, dropped to 48.6 – a 46-week low (Chart 4).
Investors Intelligence bulls are holding their ground – relatively – but they too have pulled in their horns. In the week to February 16, bulls were 59.1 percent. Ahead of this, through late January, their count remained over 60 percent for 10 straight weeks. Last week, it dropped to 51 percent – a 41-week low.
Interestingly, last week’s rally did not help sentiment much, although the surveys were taken mid-week. Perhaps important, sentiment is near the lows of last September. The S&P 500 bottomed on the 21st that month; in that week, Investors Intelligence bulls were 51.5 percent and the NAAIM index 55.3. Sentiment brightened up as stocks rallied, or it was the other way around.
Regardless which is cause and which effect, the question is, will newsletter writers and money managers get dragged into raising exposure to US stocks again?
If this scenario pans out, the odds of a breakout go up significantly on the S&P 500.
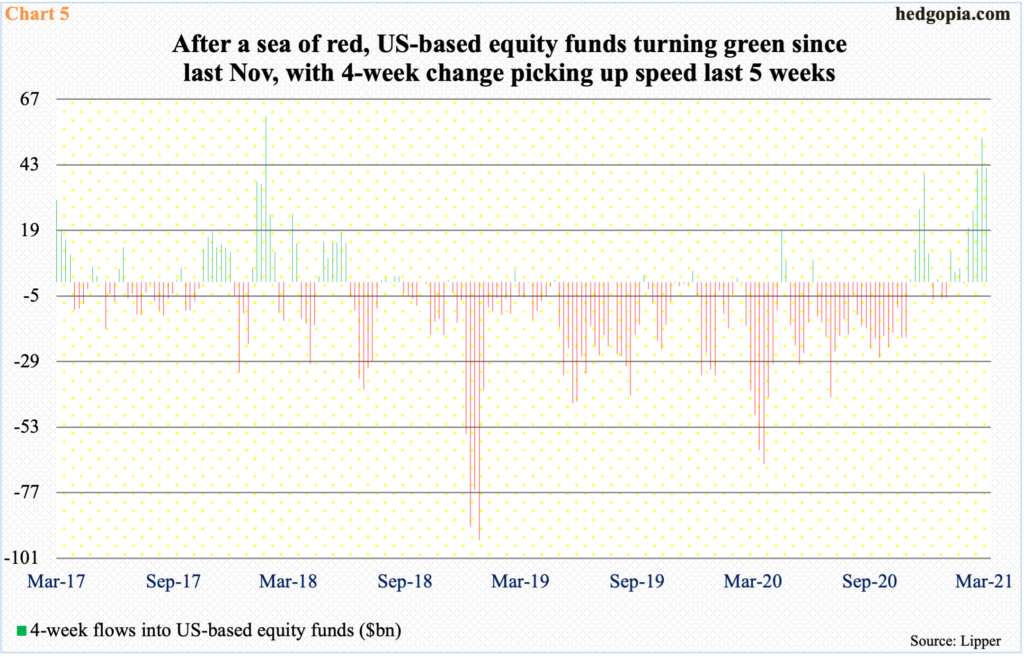
Encouragingly for bulls, flows have cooperated in recent weeks. Since the week to March 25 last year, which was the week US equity indices put in major lows, US-based equity funds have suffered withdrawals of $53.1 billion. But of late, flows have improved, taking in $67.7 billion in the five weeks to last Wednesday.
The improvement is seen in Chart 5, which uses a four-week average. After a sea of red lasting more than two years, the trend began to improve last November, with momentum picking up speed the last several weeks (QQQ).
Here is the thing. Even if flows improve in the sessions/weeks ahead but tech does not get its fair share, that will be problematic. Hence the need for tech bulls to repair the technical damage the Nasdaq 100 has sustained. The sooner the better.
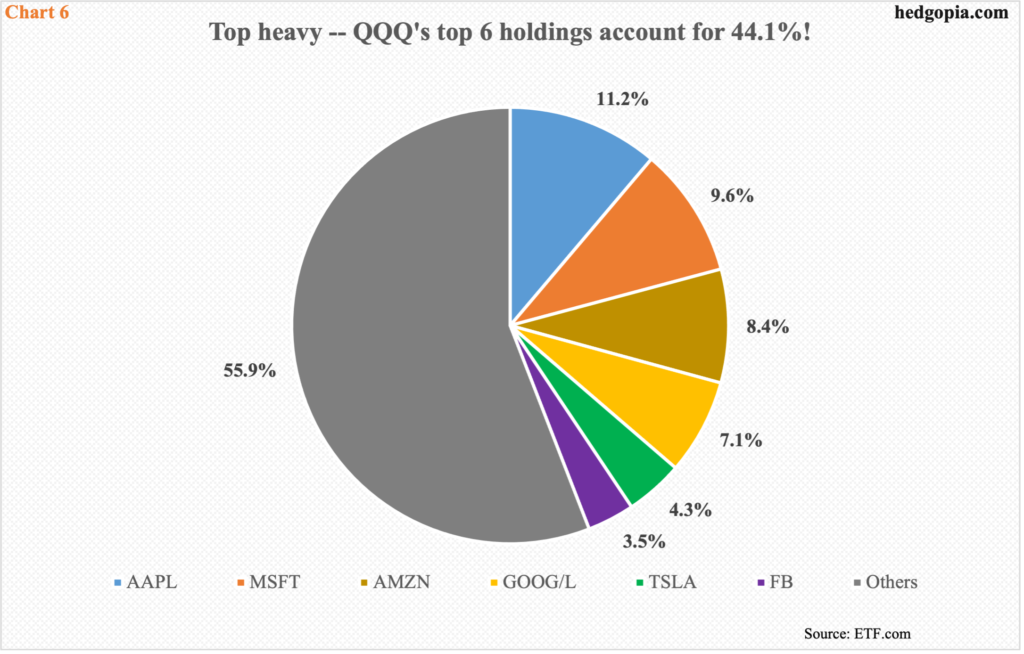
Tech is too important for the overall health of the market. The top five weights in (SPY) SPDR S&P 500 ETF – Apple (AAPL), Microsoft (MSFT), Amazon (AMZN), Alphabet (GOOGL) and Facebook (FB) – are all tech, accounting for just under 21 percent. In QQQ (Invesco QQQ Trust), the share of the top six is 44.1 percent (Chart 6).
Given the sector’s sheer weight, it is not an overstatement to say as goes the tech so go the cap-weighted indices.
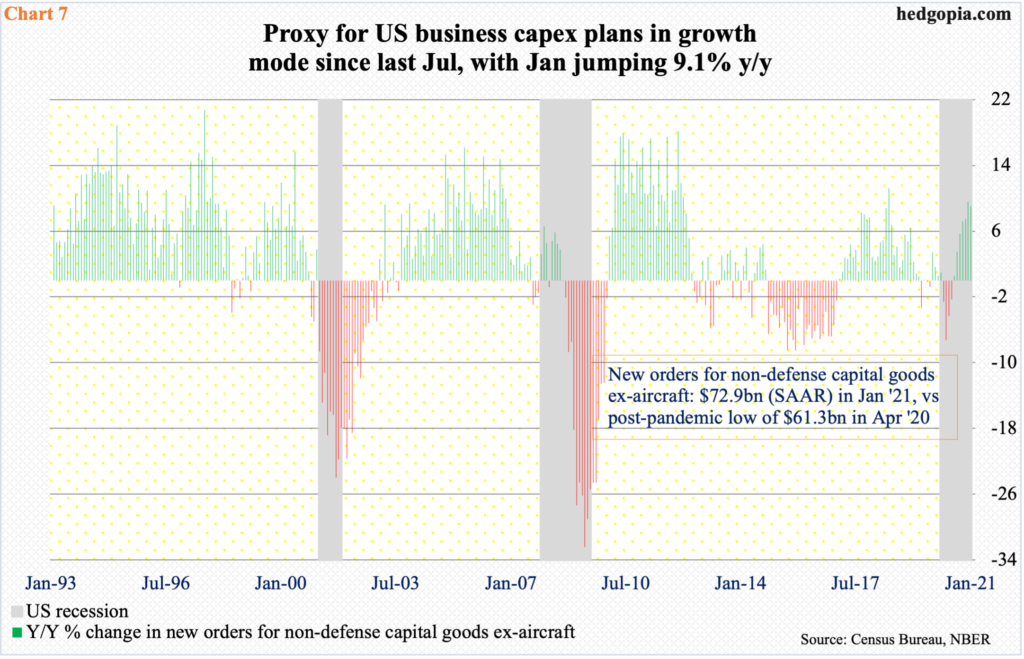
Of note, tech’s relative weakness the past several weeks has come at a time when capex has begun to improve. Post-pandemic, new orders for non-defense capital goods ex-aircraft – proxy for business capex plans – last April reached a 34-month low of $61.3 billion (seasonally adjusted annual rate). From that low, orders have grown every month, to January’s $72.9 billion – a new record. On a year-over-basis, they jumped 9.1 percent in January, following December’s 9.6 percent, which was the fastest annual pace since July 2018 (Chart 7).
Time will tell if markets are trying to tell us something. Either the expected improvement in the economy/corporate profits is in the price or markets are having second thoughts about what is priced in.
Back in 2000 when the tech/telecom bubble burst, US equity indices all peaked in March. By September, the S&P 500 just about tested that high, but the Nasdaq 100 was nowhere close. It was tech where massive excesses had built up, and when that got unwound, it brought the whole market down. The attempt here is not to draw parallels between what is transpiring now and how things evolved back then. Although it does not hurt recalling the adage history does not repeat itself, but it often rhymes.
Thanks for reading!


