
S&P 500 Is Ignoring Some Weakening Data & With Fund Flows Found Unfavorable, But...
When momentum develops, it can become a driving force greater than fundamentals and rational considerations. Such was the case for the market in Q4 2018 and with the S&P 500 (SPX) falling into a technical bear market and such has been the case in Q1 2019 with the S&P 500 rallying some 17%+ off the December 2018 bottom. It’s tough work being a permabear in 2019 thus far and with the S&P 500 up nearly 11% year-to-date, but bulls shouldn’t hang their respective hats on 1st quarter gains. There is still a great deal of time remaining in the calendar year and a great many obstacles for the market to overcome in order to not only maintain the current gains but find all-time high trading levels.
The most significant headlines that surfaced last week came in the form of economic data. It’s not all that often, of late, that we can suggest such commentary and with the geopolitical backdrop seemingly carrying the greatest impact on markets. From the U.S./China trade feud and a potential U.S. government shutdown (now averted) to Brexit concerns, the financial media has continued to feature and focus attention away from the economic data and toward geopolitics. For the sake of brevity and with regards to the ongoing U.S./China trade talks, it seems as though progress is slow going, but going nonetheless.
Both the United States and China reported progress in five days of negotiations in Beijing this week, but the White House said much work remains to be done to force changes in Chinese trade behavior. At a White House press conference on Friday, President Donald Trump said the talks with China were "very complicated" and that he might extend the March 1 deadline and keep tariffs on Chinese goods from rising. Chinas vice premier and chief trade negotiator, Liu He, and Lighthizer are to lead the next round of talks this coming week in Washington, according to Reuters.
As the calendar edges ever closer to the March 1 tariff deadline, even with President Trump’s accommodative stance on further tariff implementations, we would expect the market to hang on every headline coming out of the ongoing negotiations, but for now let’s review some of the key economic data releases from the prior week and outline the data set to be released this week.
Economic Data Proved Mixed/Sluggish
As the tax reform/stimulus brought about an acceleration of the economy through much of 2018, that stimulus simultaneously creates a high bar for which economic slowing is the likely outcome in subsequent years. We’re already experiencing the hangover effects from those lofty earnings and revenues in 2018 that are now producing negative S&P 500 earnings forecasts in Q1 2019 with greatly reduced, albeit positive, revenue estimates. Certain economic data points are also slowing and proving that geopolitical and domestic political tensions have resulted in curtailed sentiment in many aspects of the economy.
Probably the most disappointing piece of economic data for the week was the Census Bureau’s December monthly retail sales. For the month of December, the Census Bureau reported an MoM decline of 1.2%, with a rise of 2.3% year-over-year. The data was met with much conjecture as it proved to be the worst MoM dip in retail sales since 2009 and was delivered nearly 2 months late and due to the government shutdown. But within the report there seemed to also be a great deviation of a trend as it pertains to Nonstore retail sales, which showed a decline of 3.9% MoM, something also not seen since the Great Financial Crisis and yet the economy isn’t or hasn’t produced any like conditions.
(Click on image to enlarge)
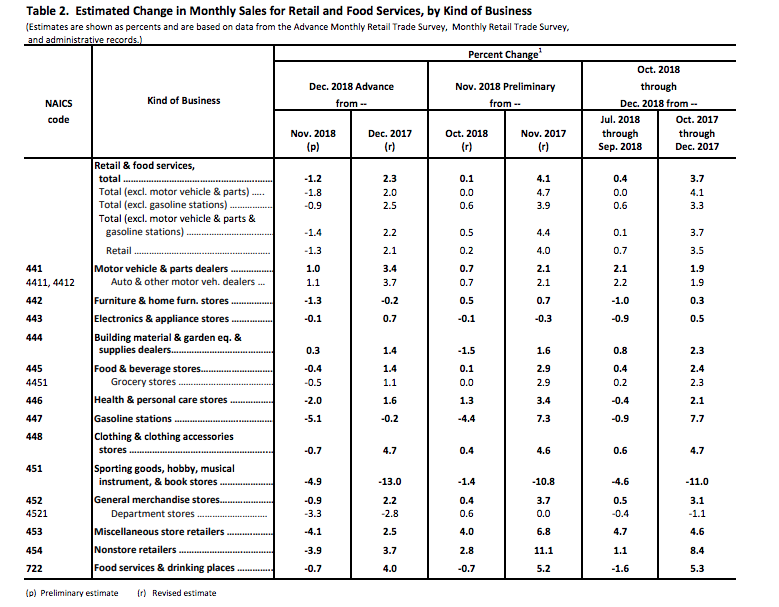
Within Finom Group’s weekly State of the Market (SOTM) video, I dive deep into the monthly retail sales report and explains why the data is found with errors and will likely see significant revisions. Within the monthly retail sales report there are some red flags in the data that just don’t make logical sense, mainly the Nonstore sales decline, which does not coincide with what Amazon (AMZN) reported in its quarterly filing and as the conglomerate constitutes some 50% of Nonstore/online sales in the United States. And then there’s the December and January Nonfarm Payroll data that saw each month adding more than 300,000 jobs.
"This is against the backdrop of the only data we had, which was the blockbuster employment numbers," said Diane Swonk, chief economist at Grant Thornton. "If the world was that bad, that was the place we should have seen it and we didn't. It leaves us all scratching our heads. It's suspect, highly suspect."
The data also conflicts with other reports of holiday shopping, including Mastercard SpendingPulse, which said holiday sales rose 5.1 percent from Nov. 1 to Dec. 26, the best in six years, and online sales rose 19.1 percent.
Additionally, there are certain one-offs that occurred during 2018 that skew the overall takeaways within the categories. The biggest YOY decline came from the Sporting goods, hobby, and toys category. This category was hit the hardest due to the Toys R Us liquidation and The Sports Authority bankruptcy. Given these one-offs, we suggest the data is not necessarily an indication of the overall health of the category or the consumer, but rather the weakness of the specialty store business model and flaws in the data collection.
To reiterate, we would be looking for sharp revisions to the December retail numbers in the coming months, but with that in mind, we do have a better understanding of the current state of consumer sentiment. The preliminary University of Michigan consumer sentiment index for February rebounded, with the index rising to 95.5 from 91.2 in January. It is still below its November peak levels, but the bounce coincides with the government reopening and stresses the importance or impact of the political strife.
(Click on image to enlarge)
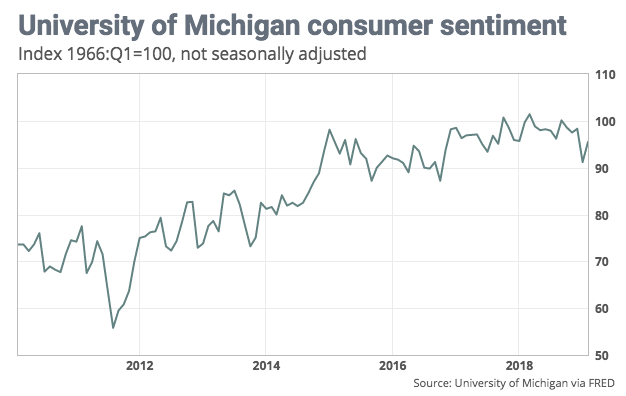
The index for expectations saw the bigger rebound, jumping to 86.2 from 79.9. The current economic conditions index rose to 110 from 108.8. Consumers’ long-term inflation expectations fell to the lowest level recorded in the past half-century. The expected inflation for the next five years fell to 2.3% from 2.6%, according to Haver Analytics.
What we consider most when it comes to consumer sentiment is how it correlates best with consumption growth. More consumers expected gains in their inflation-adjusted incomes in early February than at any other time in more than 15 years, the University of Michigan said. With this serving as a backdrop for consumption trends, the University of Michigan says the numbers are consistent with personal consumption expenditures of 2.7%, which is a healthy number and consistent with a strong economy.
While consumer sentiment rebounded in early February (will go through revisions), small business sentiment sank.
“The NFIB Small Business Optimism Index slipped 3.2 points in January, as owners continued hiring and investing, but expressed rising concern about future economic growth. The 101.2 reading, the lowest since the weeks leading up to the 2016 elections, remains well above the historical average of 98, but indicates uncertainty among small business owners due to the 35-day government shutdown and financial market instability. The NFIB Uncertainty Index rose seven points to 86, the fifth highest reading in the survey’s 45-year history."
(Click on image to enlarge)
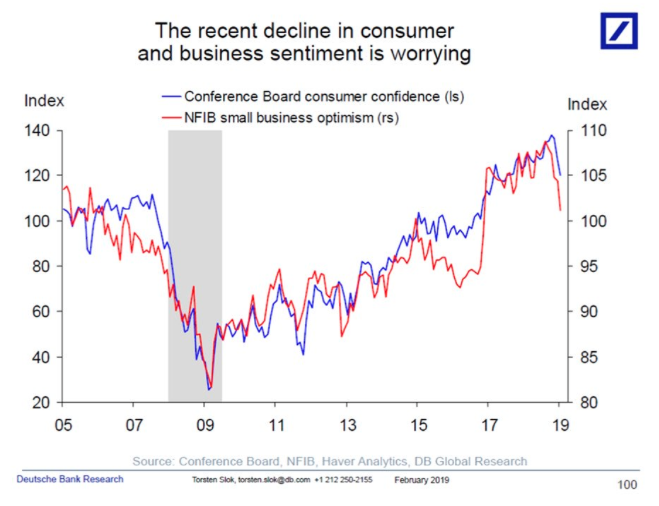
“Business operations are still very strong, but small business owners’ expectations about the future are shaky,” said NFIB President and CEO Juanita D. Duggan. “One thing small businesses make clear to us is their dislike for uncertainty, and while they are continuing to create jobs and increase compensation at a frenetic pace, the political climate is affecting how they view the future.”
As was also noted in the consumer sentiment survey, the NFIB reported concerns over the political climate. It would seem as though much of the angst surrounding economic conditions is not only manmade but easily overcome near-term and with some bilateral talks taking place.
One of the more contentious topics of the week centered on auto-loan delinquency rates, which was blown out of proportions by the permabear market participants who continue to look for leverage points given the market’s resurgence. The following chart is the most relevant in this regard and highlights that while auto loan delinquency rates should be monitored, they are quite innocuous to the overall economy and offset by improving delinquency rates elsewhere in the economy.
(Click on image to enlarge)
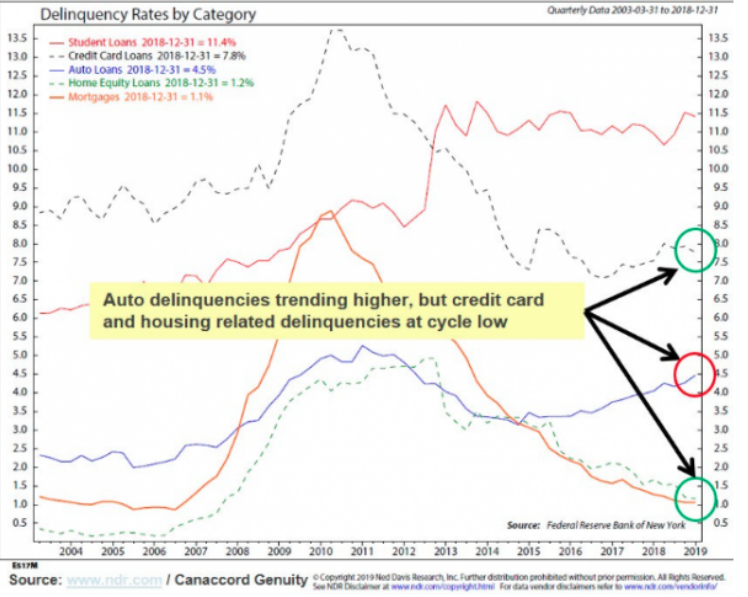
As we can depict from the chart above, the New York Fed data shows loans transitioning into serious delinquency has stabilized for autos and is declining for student debt, credit card debt and mortgage debt. The data in the chart above can also serve to validate that household debt to income ratios are finding the average household in the best position to service their debt since 2002. Government debt is the bigger issue for investors long-term at roughly $22trn and growing.
The following table highlights the coming week’s economic data releases and Fed meetings. Check out what’s happening Friday. I’ll be reviewing the FOMC minutes on Wednesday and the Leading Economic Indicators report on Friday.
(Click on image to enlarge)
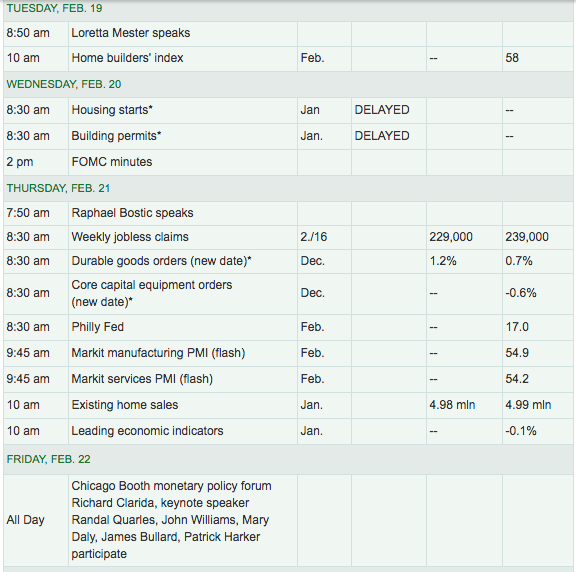
LEI is going to be key to forecasting economic strength or weakness. Even the noted permabear and bond king in waiting, Jeffrey Gundlach, has said in a recent Yahoo Finance interview that he’ll be watching the LEI report.

In his recent Yahoo Finance interview, the bond portfolio manager warns about the next recession but suggests the economy isn’t showing recessionary conditions as of yet.
S&P 500 Eyes 2,800
The weekly expected move for the S&P 500 was $41/points during the trading week and heading into Friday’s trading session it appeared as though we’d stay within the expected move. But then Friday was found with continued market momentum and another 1%+ rally in the benchmark index. The week that was marked the first week in the last 3 weeks whereby the S&P 500 breached the weekly expected move, a sign of market inefficiency. Until it becomes a trend, it’s not overly concerning and we’d expect premium sellers to continue participation until further notice.
(Click on image to enlarge)
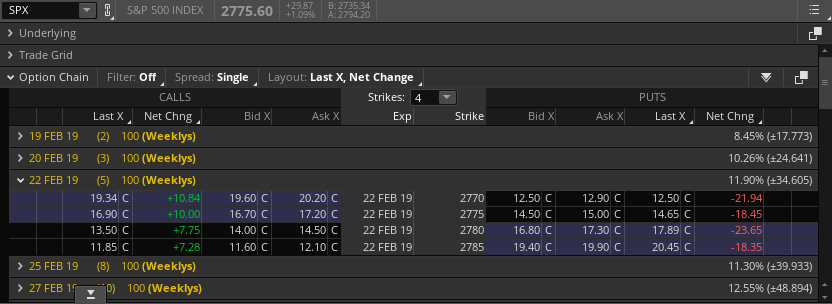
As shown in the screenshot above, the coming week is a holiday-shortened trading week and found with a lesser weekly expected move of $34/points when compared to the previous week. With the VIX breaking down over the course of 2019 and further below 15 to finish the trading week, the decline in the weekly expected move should be expected.
Because we already discussed market momentum, we feel that given the strength of the S&P 500’s rally in 2019 we should also take a look at the current state of market breadth. Have we really broken any positive ground by way of breadth indicators? Our key gauge in this regard has been whether or not the number of S&P 500 stocks are trading above there 50-DMA with the S&P 500 also trading above its 50-DMA. Those days have come and past. With the S&P 500 closing above its 200-DMA, we now concern ourselves with whether or not the majority (above 50%) of S&P 500 stocks are also trading above their 50-DMA.
In the chart above, the green line indicates a breadth breakout above the S&P 500 for over 57% of S&P 500 stocks. This indicates that momentum has been widespread in the S&P 500 or found with strong breadth. This is a net positive, but one shouldn’t use it to forecast the next leg of the market. It’s largely just validation of the market move to-date. Now that we understand the market breadth, let’s look at a key statistic regarding the old adage “as January goes, so goes the market”.
The S&P 500 is up over 10% YTD, so what happens next? Because this is such a rare feat of strength, let’s lower our criterion. Here's what happens next to the S&P when it goes up more than 8% in January & February: (C/O Troy Bombardia)
(Click on image to enlarge)
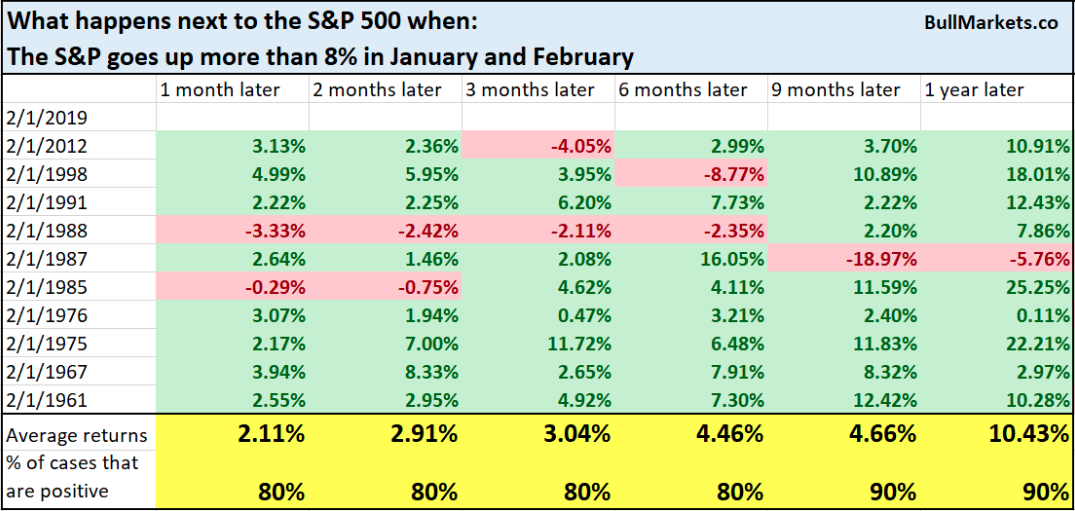
Based on the history of the S&P 500, the probability of continued gains in 2019 are above 80% across all time frames and out 12 months. Having said that, markets do not go up in a straight line and we wouldn’t allow the momentum and breadth of the market lead us into a false sense of security.
A couple of last words regarding the S&P 500 and something to keep front of mind this week:
(Click on image to enlarge)
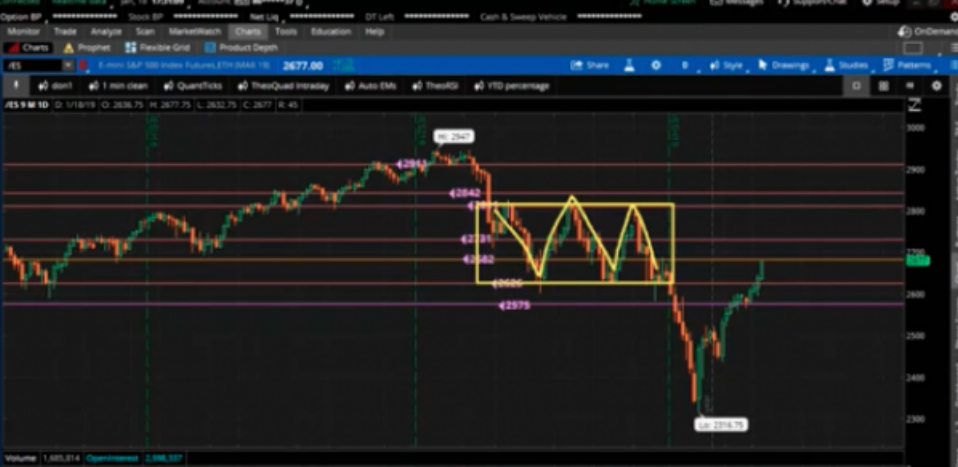
The screenshot above is my infamous S&P 500 BOX. The triple top represents SPX 2,800-2,807 and at the current rate, the SPX seems likely to touch 2,800 near-term. In an algorithmic trading environment that bore witness to systemic level seeking and achieving on the way down in 2018, we are seeing the same pattern on the way back up. If algos and patterns rule the day, the 2,800 level is a highly probable outcome. But what happens if 2,800 is achieved?
The major averages and index ETFs are overbought and overbought with net fund outflows, quite the unique scenario. (See SPY/Fund Flow chart)
(Click on image to enlarge)
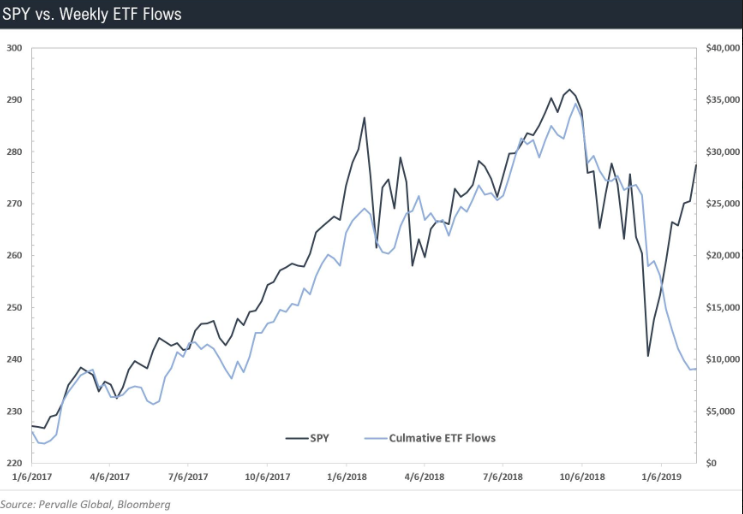
While a unique occurrence, this was much the same scenario for portions of 2018 and until liquidity dropped out of the market in Q4 2018. It’s important to recognize that fund flows will demand a shift near term in order to sustain the market’s YTD trajectory. The good news is that may already be happening. In the past week, Equity ETFs captured net inflows. For equity ETFs, SPDR S&P 500 ETF (SPY, +$1.3 billion) had the largest individual net inflows by far, according to Lipper U.S. Weekly FundFlows Report.
While the Q1 earnings estimates continue to fall week-to-week, the market is seemingly pricing progressive earnings improvements post the Q1 period. FactSet offers the key metrics through the Q4 2018 earnings reporting season as follows:
- Earnings Scorecard: For Q4 2018 (with 79% of the companies in the S&P 500 reporting actual results for the quarter), 70% of S&P 500 companies have reported a positive EPS surprise and 62% have reported a positive revenue surprise.
- Earnings Growth: For Q4 2018, the blended earnings growth rate for the S&P 500 is 13.1%. If 13.1% is the actual growth rate for the quarter, it will mark the fifth straight quarter of double-digit earnings growth for the index.
- Earnings Revisions: On December 31, the estimated earnings growth rate for Q4 2018 was 12.1%. Seven sectors have higher growth rates today (compared to December 31) due to upward revisions to EPS estimates and positive EPS surprises.
- Earnings Guidance: For Q1 2019, 59 S&P 500 companies have issued negative EPS guidance and 19 S&P 500 companies have issued positive EPS guidance.
- Valuation: The forward 12-month P/E ratio for the S&P 500 is 16.0. This P/E ratio is below the 5-year average (16.4) but above the 10-year average (14.6).
Looking forward:
- For Q1 2019, analysts are projecting a decline in earnings (-2.2%) and revenue growth of 5.3%.
- For Q2 2019, analysts are projecting earnings growth of 1.0% and revenue growth of 4.7%.
- For Q3 2019, analysts are projecting earnings growth of 2.4% and revenue growth of 4.5%.
For Q4 2019, analysts are projecting earnings growth of 9.1% and revenue growth of 5.0%. - For CY 2019, analysts are projecting earnings growth of 4.8% and revenue growth of 4.9%.
Investor Takeaways
This has been one heck of a market rally in 2019. But why? Fund flows have largely been negative, economic data shows signs of slowing growth, EPS estimates have been lowered with each passing week and even the Fed has turned from hawkish to dovish. There are a great many hypotheses thrown about as to why all the negatives surround the investor and analyst sentiment; the market has climbed the wall of worry. The reality is that earnings are still expected to grow in 2019 despite such worries. Additionally, when we look at revenue growth (noted above) estimates, something seems amiss when compared to or positioned with EPS estimates. Q1 revenue and EPS estimates are a perfect example of this strange correlation. One would expect to see revenue declines given the earnings estimate declines, but… well, that’s not what corporations are guiding toward. Given what occurred and what the analysts through Q4 2018 and into 2019, regarding earnings, have heralded are corporations simply delivering earnings forecasts that analysts expect? But revenue projections, even with the strength of the U.S. Dollar…again, something doesn’t add up and the market may be pricing this disconnect with the YTD rally, expecting Q1 2019 beats. We’ll see!
Earnings season isn’t quite complete and in the coming weeks, retailers will be reporting their Q4 2018 and holiday period earnings and sales. The consumer, some 70% of GDP, primarily drives the U.S. economy. Naturally, that is why GDP estimates have been revised sharply lower after the December monthly retail sales report.
While the market headwinds are well-known, the future remains uncertain and littered with obstacles. If you’ve missed a good portion of the market’s rally, chasing is never a good idea. In order to extrapolate long-term profitable investments from the market, one needs to express a disciplined approach to investing and/or trading. The market will ebb and flow, rise and fall. As such, a disciplined and patient approach will pay off in the long run.
Last, but certainly not least, keep a watchful eye on the 10s and 2s. With a chronically flattening yield curve, the eventual inversion looms. While the yield curve has gone without headlines or even passerby discussion of late, it may come back into focus if the curve flattens out further near-term.
(Click on image to enlarge)

Historically, an inversion does not bode well for the economy. An inverted yield curve means that short-term rates are higher than their long-term peers. This happens as demand for longer-term notes/bonds goes up because investors are pessimistic about the economy’s short-term prospects. Keep this on your radar folks!


