
S&P 500 Investors Rein In Expectations For Monetary Policy, Shift Time Horizon
As expected, answers to the questions we asked last week were forthcoming, allowing us to eliminate one of the two primary hypotheses we raised for what caused the S&P 500 (SPX) to suddenly drop 5.9% on 11 June 2020.
The first hypothesis was that S&P 500 shifted their time horizon from 2020-Q4 to 2020-Q3, without any change in expectations for how expansionary the Fed's monetary policies would be, which is consistent with the first version of the alternative futures chart for 2020-Q2:

For this hypothesis to hold, we would have needed to see the trajectory of the S&P 500 track along with the expectations associated with investors focusing their forward-looking focus on 2020-Q3. We also indicated what we might expect to see if this hypothesis failed:
... if the shift that occurred on June 11, 2020 was the result of a change in expectations for the Fed's monetary policies, where the amplification factor in the dividend futures-based model suddenly changed to become less negative than it has been, we will see the trajectory of the S&P 500 start to consistently underrun the levels projected by the model as shown on the alternative futures chart above, which currently assumes no change in the amplification factor since 12 April 2020.
And that's indeed what happened, which allows us to reject this first hypothesis.
In the remaining hypothesis, we assume investors have incorporated the new expectation the Fed's monetary policies will be less expansionary going forward than they had previously anticipated, which we're showing in the change of the value of the dividend futures-based model's amplification factor (m) from -1 to 0:

There's a second variation of this hypothesis that assumes there was also a Lévy Flight event with investors shifting their attention inward from 2020-Q4 toward 2020-Q3, but we're unlikely to ever untangle that possibility with the limited data we have available.
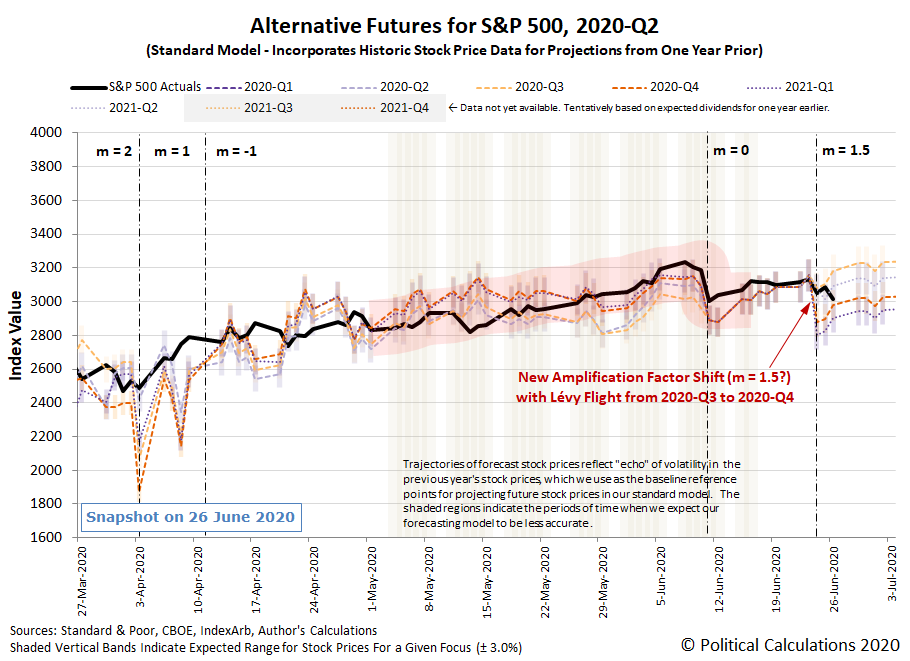
That's because both these variations are consistent with what we observed in the last week, up until 24 June 2020. That date coincides with when we think another adjustment occurred to further rein in expectations for how expansionary the Fed's monetary policies will be going forward, which we see as a change in the amplification factor in the dividend futures-based model. We think the new value has risen to now fall somewhere between 1 and 1.5.
In the next version of the alternative futures chart, we show the amplification factor changing from 0 to 1 on 24 June 2020, where we assume investors have sustained their focus on 2020-Q4 since 4 May 2020.

Let's present one more new scenario. Here, let's show the amplification factor changing from 0 to 1.5 on 24 June 2020, but now, we'll assume that investors shifted their forward-looking time horizon from 2020-Q4 to 2020-Q3 on Friday, June 26, 2020.
We don't yet know which of these new scenarios might better explain how the S&P 500 behaved last week. But at the very least, we have new hypotheses and variations we can test with observations, which is a big part of what we do behind the scenes when we develop our analysis. We want to give you a sense of what that work is like with this latest edition of the S&P 500 chaos series, which we hope you find useful in developing your own insights.
Let's now recap the main market-driving news headlines from the week that was....
Monday, 22 June 2020
- Daily signs and portents for the U.S. economy:
- Mixed picture emerging for global recovery:
- Bigger stimulus developing in U.S., Mexico:
- ECB, EU minions don't want to lose control:
- Fed minions consider future for U.S. economy, monetary policy:
- Oil, stocks gain, but rising infection rates spark concerns
Tuesday, 23 June 2020
- Daily signs and portents for the U.S. economy:
- Fed minion says Fed's policies not making inequality worse:
- Signs and portents in the Eurozone:
- Wall Street ends higher on recovery hopes, Nasdaq hits another record
Wednesday, 24 June 2020
- Oil dives over 5% as U.S. crude stocks hit record, COVID cases mount
- Bigger trouble developing in Brazil:
- Bigger stimulus developing in the U.S., Japan:
- Fed minions look into future, unhappy with past.
- Shadows being cast over Eurozone:
- Wall Street finishes lower on rising virus cases, weak economic view
Thursday, 25 June 2020
- Daily signs and portents for the U.S. economy:
- Oil prices climb as U.S. economic data lends support
- Fed balance sheet down again as currency swaps fall further
- The rate of growth of the Fed's balance sheet has been a factor in driving the coronavirus stock market rally, in the current environment and the absence of a solid recovery, if it slows down or reverses, indicating a less expansionary monetary policy for investors, a number of analysts believe stock prices will follow.
- Bigger trouble developing in the Eurozone:
- How the ECB's minions will get permission to provide bigger stimulus:
- Fed minions advance gloomy outlook:
- Wall Street ends choppy session higher as strength in banks offsets virus woes
Friday, 26 June 2020
- Daily signs and portents for the U.S. economy:
- Bigger trouble developing in Japan, Mexico:
- Bigger stimulus developing in the Eurozone:
- ECB minions pushing out and pushing for more stimulus
- Wall Street ends lower as coronavirus surge prompts renewed restrictions
Barry Ritholtz summarized the positives and negatives he found in the week's markets and economy news.
This upcoming trading week will be shortened by the Independence Day holiday, but we'll be back to recap the week next Monday....
Disclaimer: Materials that are published by Political Calculations can provide visitors with free information and insights regarding the incentives created by the laws and policies described. ...
more

