
S&P 500 Index To Track Progress On US Stimulus Ahead Of Deadline
S&P 500 INDEX, US FISCAL AID TALKS, US PRESIDENTIAL ELECTIONS, CORONAVIRUS – TALKING POINTS:
- Equity markets climbed higher during the Asian trading session as investors digested the progress in US fiscal aid talks.
- House Speaker Pelosi’s 48-hour deadline on bipartisan negotiations threatens to trigger a period of risk aversion.
- S&P 500 index poised to move higher as price carves out a Bull Flag continuation pattern.
ASIA-PACIFIC RECAP
Equity markets moved broadly higher during Asia-Pacific trade, with Australia’s ASX 200 index climbing 0.85% and Japan’s Nikkei 225 index climbing over 1.2%.
Mixed economic data out of China took some of the wind out of the sails of the cyclically-sensitive Australian Dollar, as it retreated from session-highs after the announcement.
Gold clamber back above the $1,900/oz mark and silver stormed 1.7% higher, as the haven-associated US Dollar slid lower.
Looking ahead, speeches from European Central Bank President Christine Lagarde and Federal Reserve Chair Jerome Powell headline the economic docket.
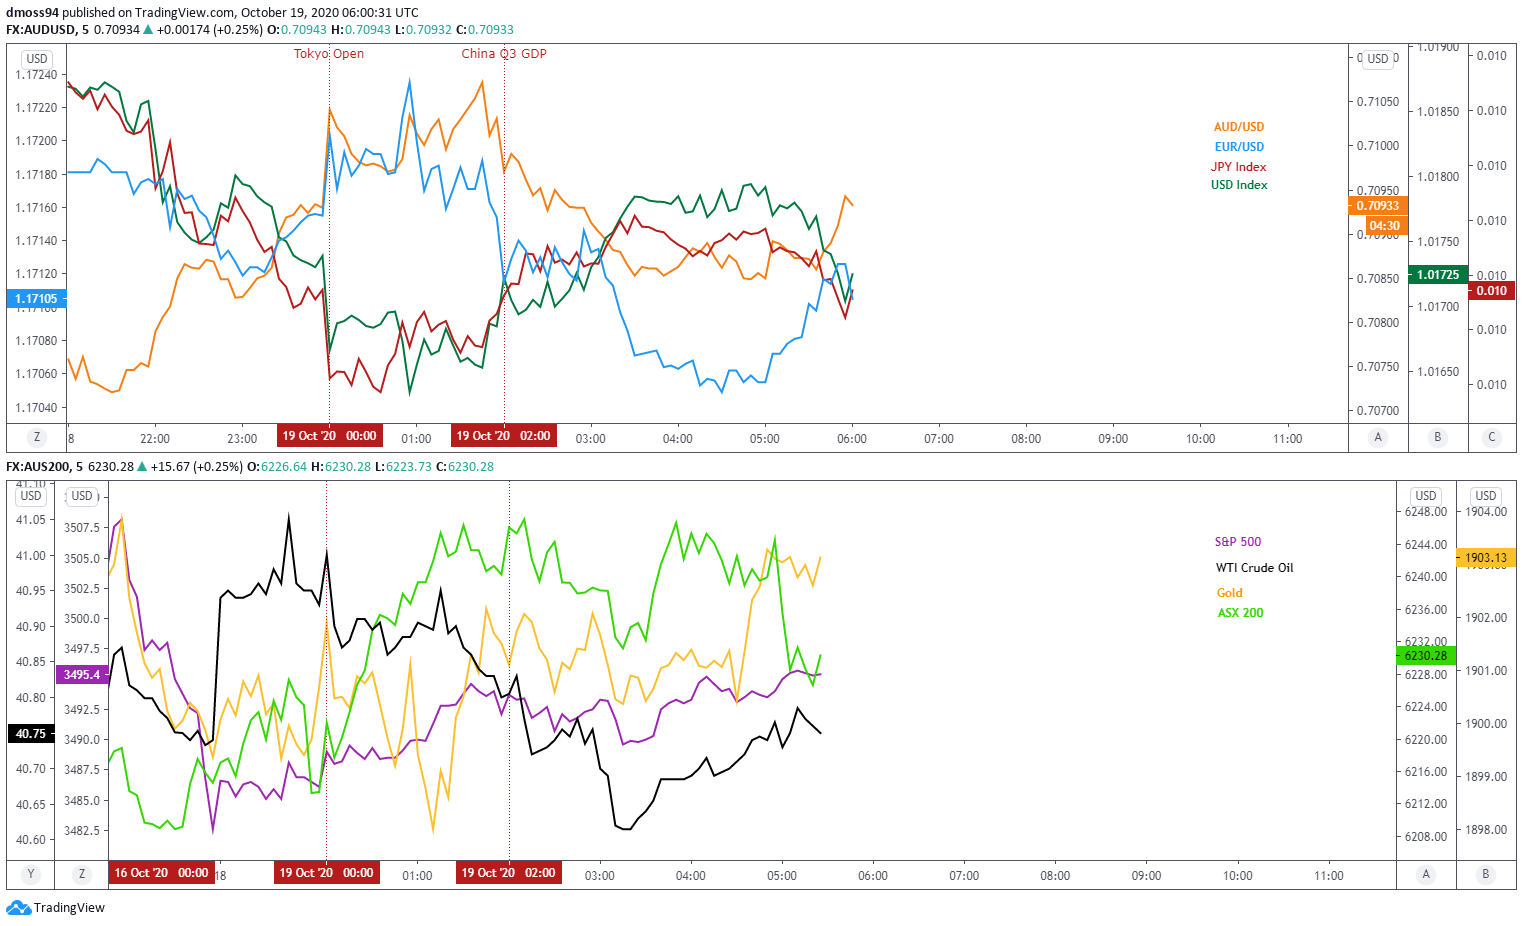
Market reaction chart created using TradingView
48-HOUR DEADLINE ON STIMULUS TALKS COULD HAUNT US BENCHMARK INDICES
The ongoing battle between Republicans and Democrats on the specifics of a much-needed, and long overdue, fiscal aid package is likely to dictate the near-term outlook for US benchmark equity indices, as House Speaker Nancy Pelosi announces that she and Treasury Secretary Steven Mnuchin must reach an agreement within 48 hours “if we want to get it done before the election, which we do”.
Given that the US is currently averaging more than 50,000 new coronavirus infections a day and initial jobless claims rose by 898,000 (est. 825,000) in the week ended October 10, the need for additional fiscal support is becoming increasingly urgent.
Moreover, Federal Reserve Chairman Jerome Powell warned that the absence of “an additional pandemic-related fiscal package” could see growth “decelerate at a faster-than-expected pace in the fourth quarter”, while his Vice Chair Richard Clarida also stressed the need for “additional support from fiscal policy” given that “it will take some time to return to the levels of economic activity and employment that prevailed at the business cycle peak in February”.
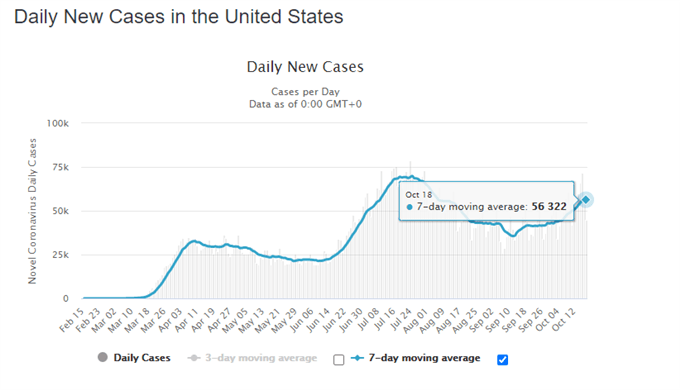
Source - Worldometer
However, with Mnuchin stating that although he and Pelosi “continue to make progress on certain issues, we continue to be far apart on others” and adding that “getting something done before the election and executing on that would be difficult”, it seems relatively unlikely that a deal will be passed before the US presidential elections on November 3.
Furthermore, in the off-chance that a bill is agreed upon there is a distinct possibility that it will be voted-down in the Senate, given Senate Majority Leader Mitch McConnell favours a significantly narrower aid package that will cost roughly $500 billion and has stated that “the speaker insists on an outrageous amount of money”.
Therefore, a resurgence of risk aversion may be at hand if US policymakers are unable to successfully get a deal across the line before Speaker Pelosi’s deadline in two days.
‘BLUE WAVE’ HOPES UNDERPINNING EQUITY PRICES
Having said all that, recent price action suggests that the market may be looking beyond the lack of fiscal aid and could be beginning to price in a Biden presidency, which is expected to bring with it a substantial injection of stimulus if the Senate flips to a Democratic majority.
With only 14 days until the election and with Mr Biden holding a commanding lead over the incumbent President Donald Trump in the national polls, a Democratic administration certainly seems to be a likely possibility.
However, the rate of change in the RealClearPolitics Betting Average index suggests that Mr Trump could narrow the gap substantially in the coming days, if this trend were to continue.
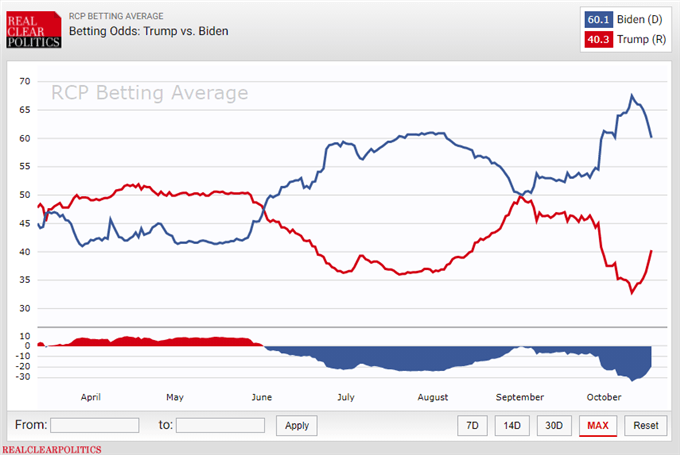
Source – RealClearPolitics
To that end, although the absence of much-needed fiscal aid may weigh on US asset prices in the near term, the growing likelihood of a Biden win in November could see market participants begin to price in a more extensive government support package and in turn direct capital flows into risk-associated assets.
Conversely, further losses could be in the offing if incumbent President Donald Trump begins to claw back lost ground against his Democratic challenger, as is reflected in the S&P 500 index’s recent 4-day slide lower on the back of Trump’s nudge higher in the national polls.
S&P 500 INDEX DAILY CHART – BULL FLAG IN PLAY?
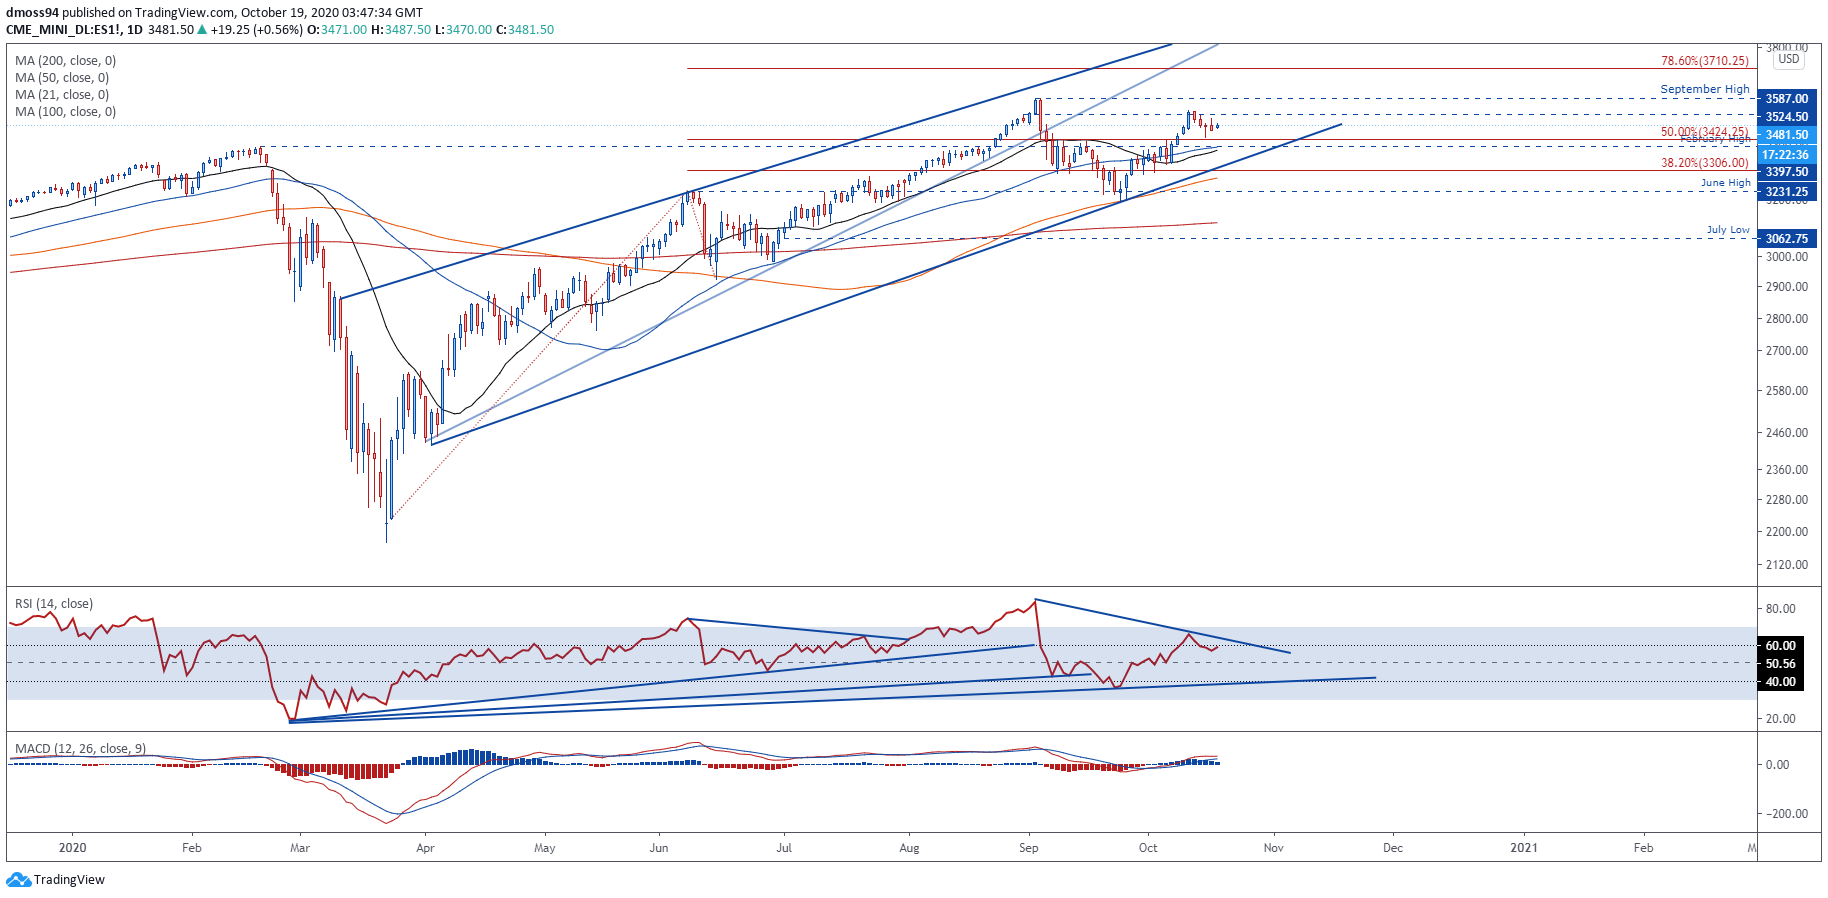
S&P 500 index daily chart created using TradingView
As expected, the US benchmark S&P 500 index’s inability to break above psychological resistance at the 3550 mark resulted in price sliding just over 3% and back towards support at the 50% Fibonacci (3424.25).
This retreat from the monthly high however, may prove to be a mere short-term pullback as price scurries away from the 50% Fibonacci and the RSI eyes a cross back above 60 and into bullish territory.
Moreover, with the MACD indicator tracking firmly above its neutral midpoint and the slope of the 21-day moving average (3384) notably steepening, the path of least resistance seems higher.
A break back above the August high (3524.50) would likely signal the resumption of the primary uptrend and carve a path for price to test the record high set on September 2 (3587).
Conversely, a breach of confluent support at the trend-defining 50-DMA (3396) and February high (3397.50) could ignite a more extended pullback and bring the 38.2% Fibonacci (3306) into focus.
S&P 500 4-HOUR CHART – 50-MA GUIDING PRICE HIGHER
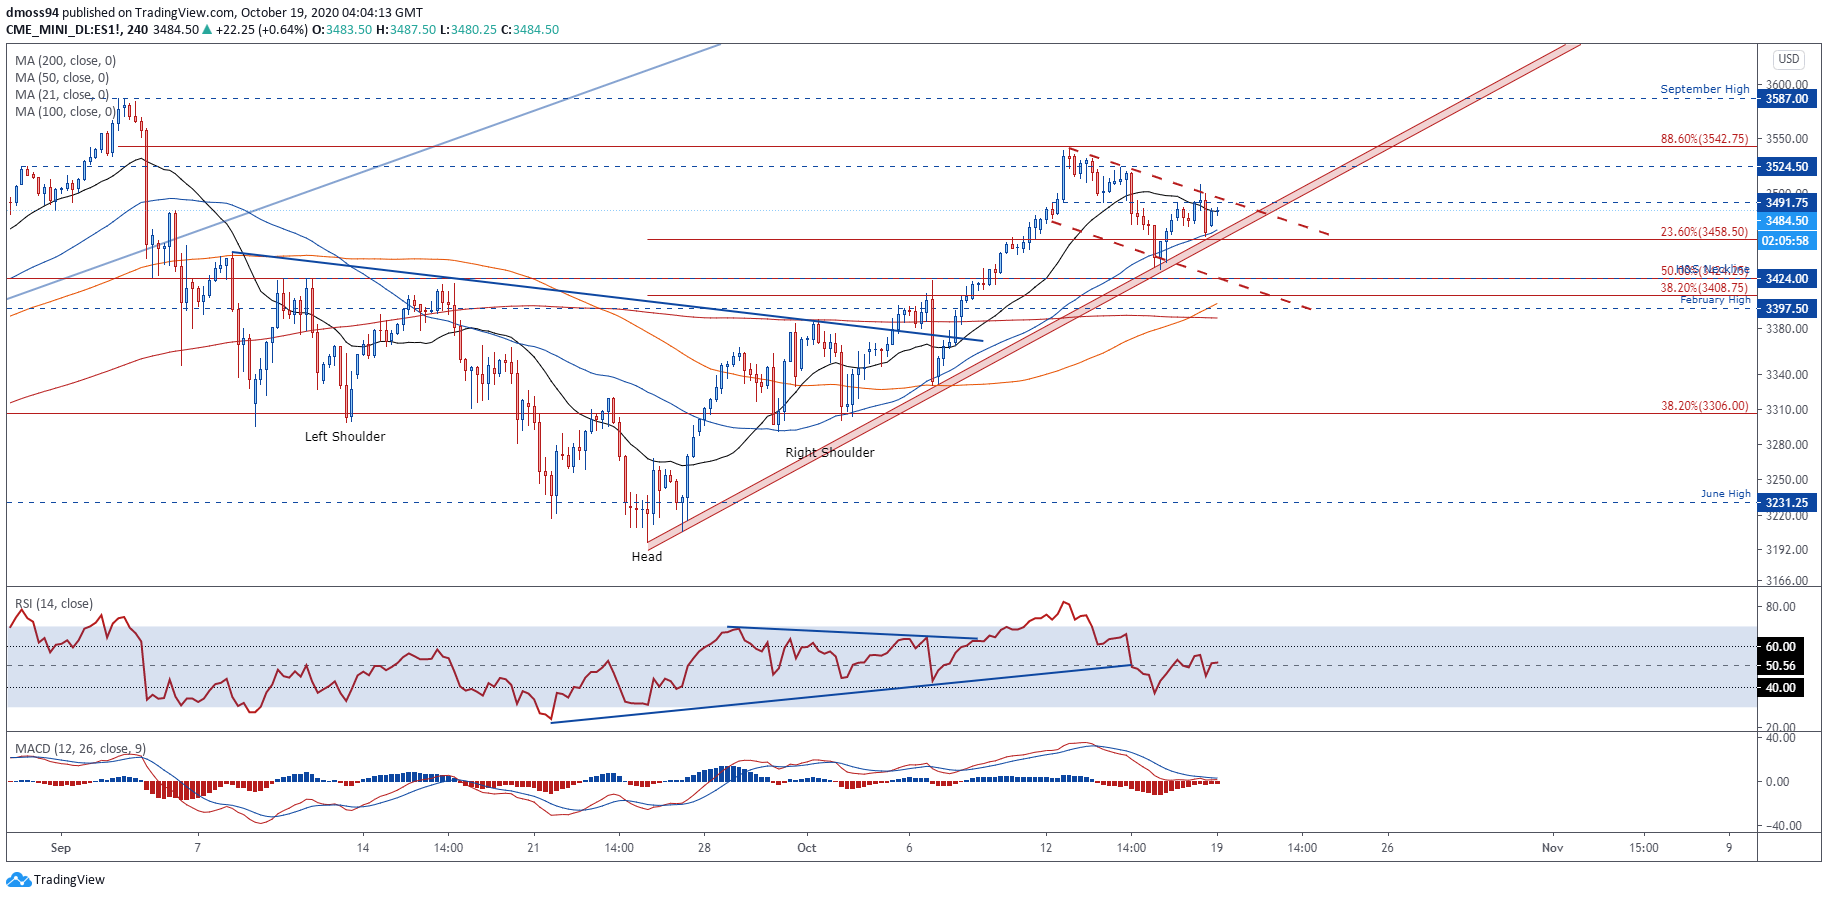
S&P 500 index daily chart created using TradingView
Zooming into a 4-hour chart reinforces the bullish outlook depicted on the daily timeframe, as price carves out a Bull Flag continuation pattern and continues to scale the uptrend extending from the September low (3198).
Moreover, the development of the RSI and MACD indicators hint at swelling bullish momentum, as both oscillators continue to travel firmly above their respective midpoints.
A break above the October 16 high (3508.50) is needed to validate the bullish continuation pattern, with the implied measured move (3702) suggesting price could push to fresh record highs and test the psychologically imposing 3700 level.
On the other hand, a break and close below the 23.6% Fibonacci (3458.50) would probably encourage further selling pressure and generate a push to test the February high (3397.5).
S&P 500 INDEX IG CLIENT SENTIMENT
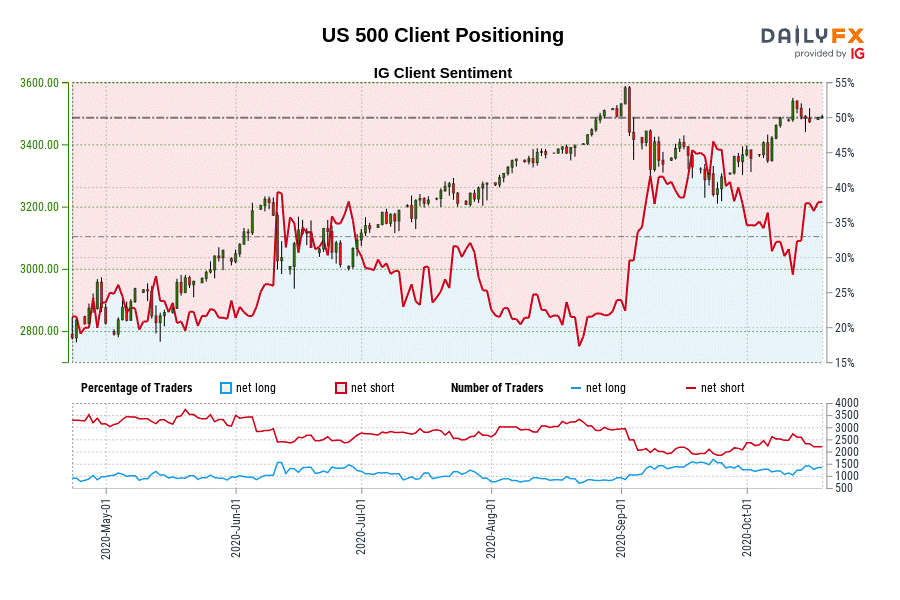
Retail trader data shows 38.27% of traders are net-long with the ratio of traders short to long at 1.61 to 1. The number of traders net-long is 7.97% higher than yesterday and 19.48% higher from last week, while the number of traders net-short is 0.50% higher than yesterday and 10.79% lower from last week.
We typically take a contrarian view to crowd sentiment, and the fact traders are net-short suggests US 500 prices may continue to rise.
Yet traders are less net-short than yesterday and compared with last week. Recent changes in sentiment warn that the current US 500 price trend may soon reverse lower despite the fact traders remain net-short.
Disclosure: See the full disclosure for DailyFX here.


