
S&P 500 Gets Closer To 2,800, Will Stocks Continue Higher?
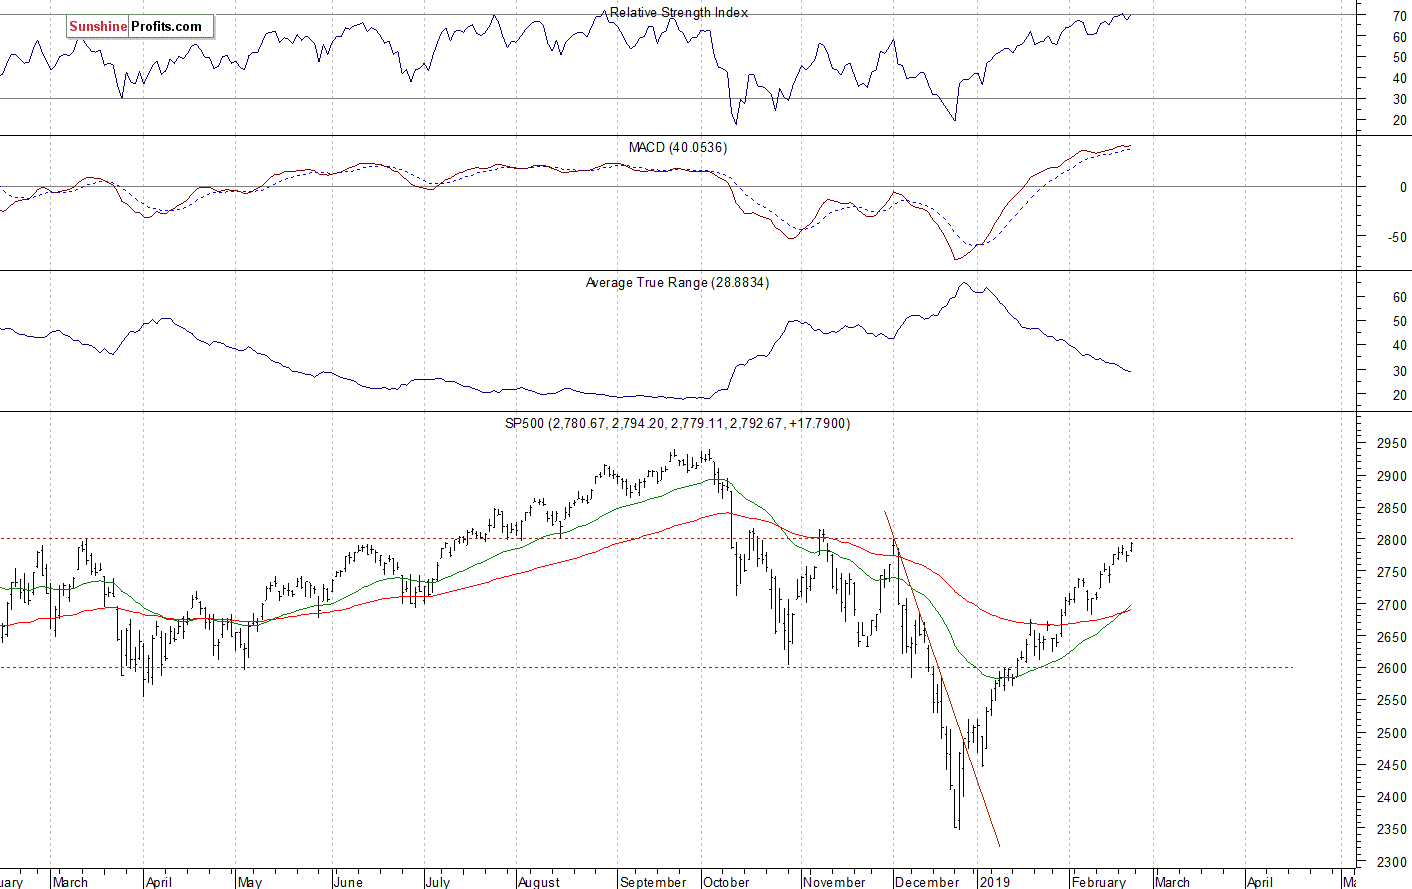
The U.S. stock market indexes gained 0.6-0.9% on Friday, as investors' sentiment remained bullish following the recent advances. The S&P 500 index retraced more of its October-December downward correction of 20.2%. It got closer to the previous local highs along the 2,800 level. The Dow Jones Industrial Average gained 0.7% and the Nasdaq Composite gained 0.9% on Friday.
The nearest important resistance level of the S&P 500 index remains at around 2,800, marked by the previous medium-term local highs. On the other hand, the support level is now at 2,765-2,780, marked by the recent local lows. The support level is also at the previous Friday's daily gap up of 2,757.90-2,760.24.
The broad stock market retraced all of its December sell-off and it got closer to the medium-term resistance level of around 2,800, marked by the October-November local highs. So is it still just a correction or a new medium-term uptrend? The market broke above the 61.8% Fibonacci retracement of the 20% decline. And we may see an attempt at getting back to the record highs. But will the index break above the mentioned previous local highs? There have been no confirmed negative signals so far:
Positive Expectations Again
Expectations before the opening of today's trading session are positive because the index futures contracts trade 0.5-0.7% above vs. their Friday's closing prices. The European stock market indexes have been mixed so far. Investors will wait for the Wholesale Inventories number release at 10:00 a.m. The broad stock market will likely extend its uptrend again today, but then it may fluctuate along the level of 2,800. We may see an attempt at breaking above the October-November medium-term highs.
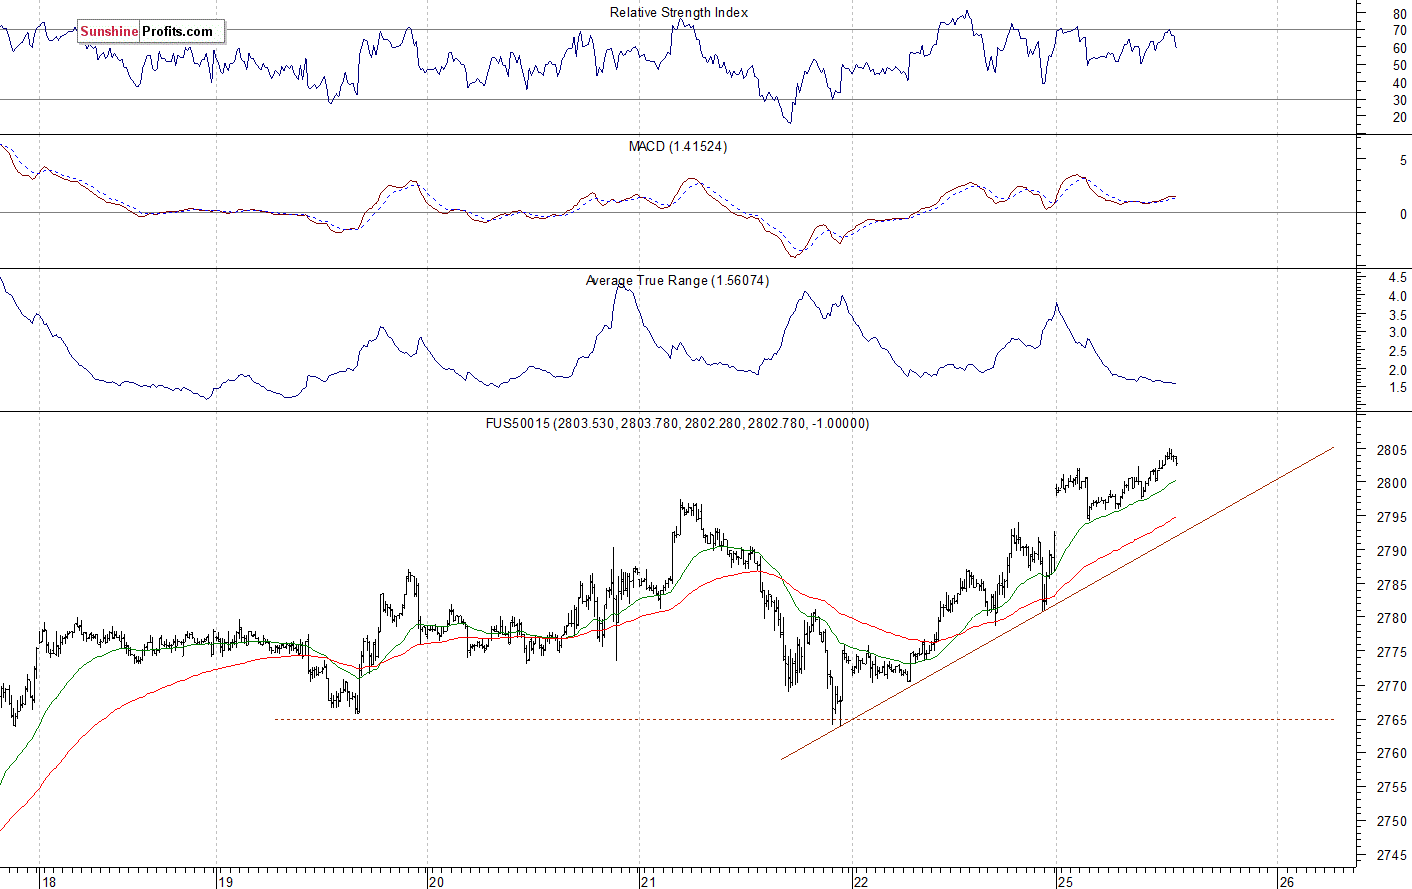
The S&P 500 futures contract trades within an intraday uptrend, as it reaches new short-term highs. The market is now above the 2,800 mark. The support level is now at around 2,790-2,795, among others. The futures contract remains above the two-day-long upward trend line, as the 15-minute cart shows:
Nasdaq Also Higher
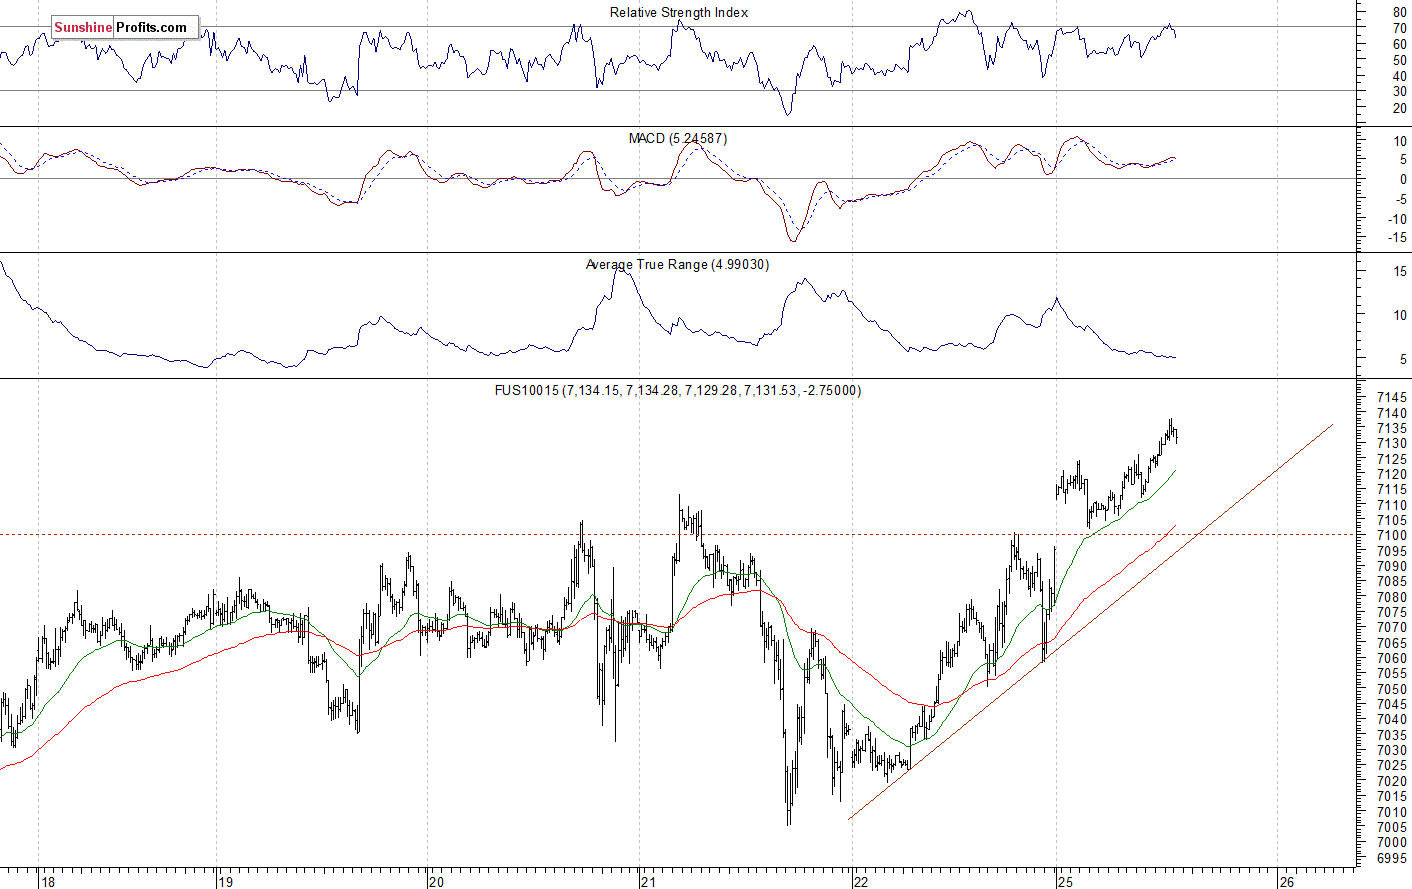
The technology Nasdaq 100 futures contract follows a similar path, as it trades within an intraday uptrend. The market gained more than 1,300 points from December the 26th local low of around 5,820. The nearest important resistance level remains at 7,150. The support level is now at 7,050-7,100, marked by the recent resistance level. The support level is also at 6,950-7,000. The Nasdaq futures contract trades close to the short-term local high this morning, as we can see on the 15-minute chart:
Apple, Amazon - Will They Break Higher?
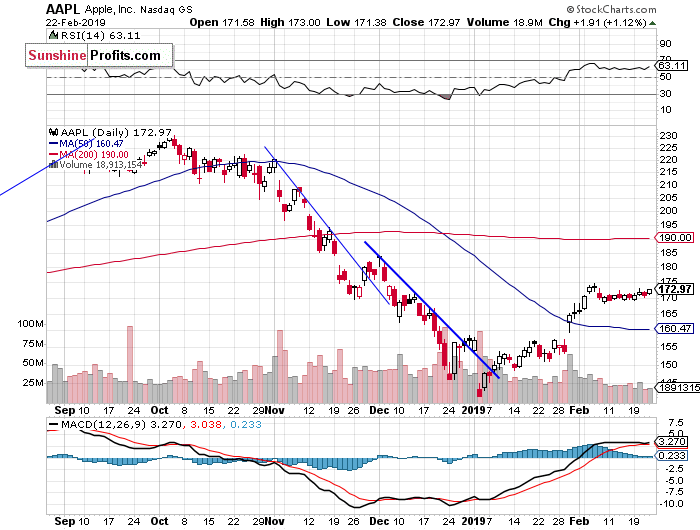
Let's take a look at the Apple, Inc. stock (AAPL) daily chart (chart courtesy of http://stockcharts.com). The stock broke above its January's trading range and the resistance level of $155-160 following the quarterly earnings release. It retraced some more of its November-December sell-off. But then it bounced off $175. It still looks like a relatively flat short-term correction:
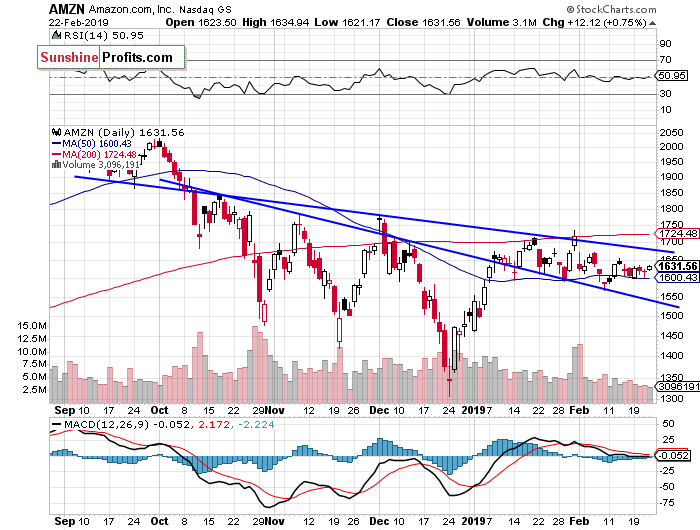
Now let's take a look at the daily chart of Amazon.com, Inc. (AMZN). The market broke above one of its three-month-long downward trend lines two months ago. Since then it has been going sideways. There is a resistance level at around $1,700-1,750. Recently it bounced off that resistance level following the quarterly earnings release. The stock got closer to the downward trend line again, but then it came back slightly lower again. Overall, it looks like a sideways trend:
Dow Jones at New High
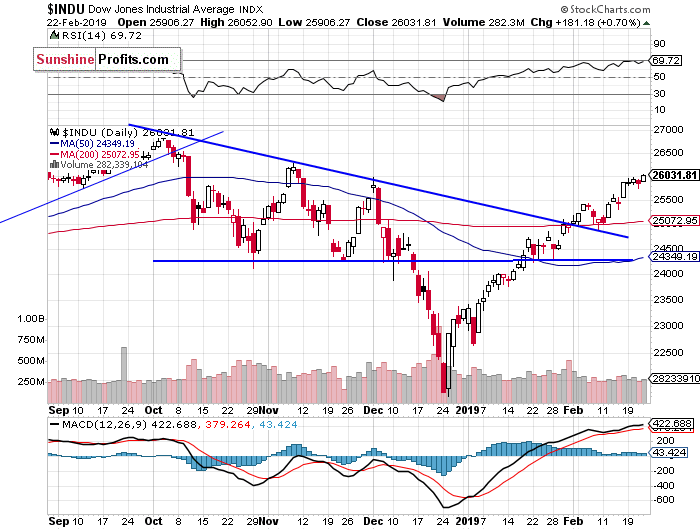
The Dow Jones Industrial Average extended its short-term uptrend last week. The blue-chip stocks' gauge is now slightly above the resistance level of 26,000. So will it continue higher and reach the record high? Or reverse lower in the near term? There have been no confirmed negative signals so far:
Japanese Nikkei Also Slightly Higher
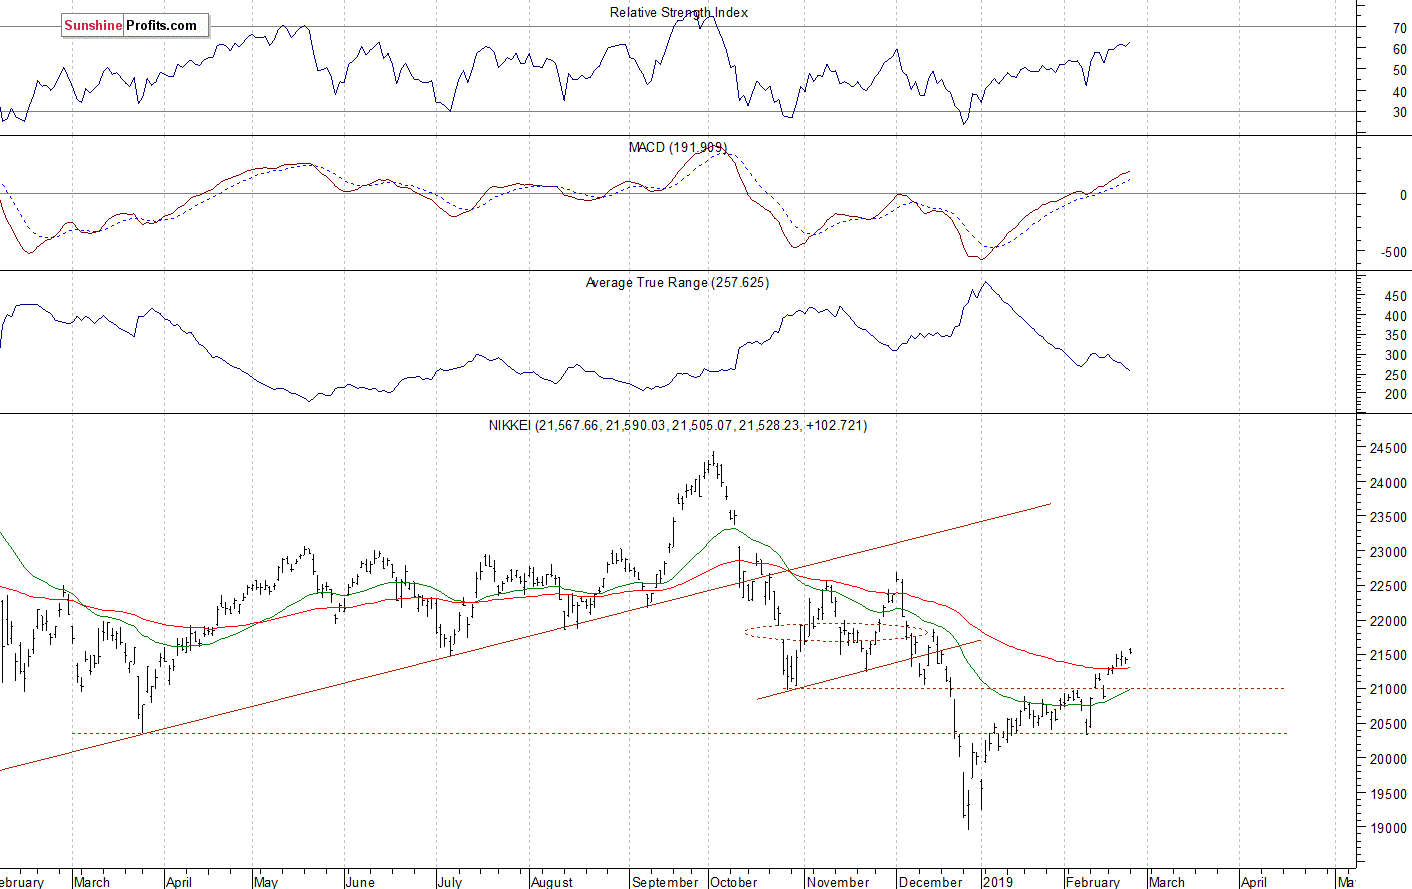
Let's take a look at the Japanese Nikkei 225 index. It accelerated the downtrend in late December, as it fell slightly below the level of 19,000. Since then it has been retracing the downtrend. Recently the market broke above its recent local highs and the 21,000 resistance level. The next important resistance level is at 21,600-22,000, marked by the December consolidation:
The S&P 500 index slightly extended its recent run-up on Friday. It is now close to the medium-term resistance level of around 2,800. Is this a new medium-term uptrend or still just upward correction before another medium-term leg lower? The market trades above the 61.8% Fibonacci retracement of the whole medium-term decline. There have been no confirmed negative signals so far.
Concluding, the S&P 500 index will likely open higher today. We may see an attempt at breaking above the 2,800 mark. There are still some short-term technical overbought conditions.
Disclosure: None.


