
S&P 500: Friday's Rally Was A Bull-Trap, What Next?
The U.S. stock market indexes gained 0.8-1.6% on Friday, as investors reacted to better-than-expected monthly jobs data release. The S&P 500 index retraced most of its Thursday's decline and it got closer to the record high again. The Dow Jones Industrial Average gained 0.8% and the Nasdaq Composite gained 1.6% on Friday.
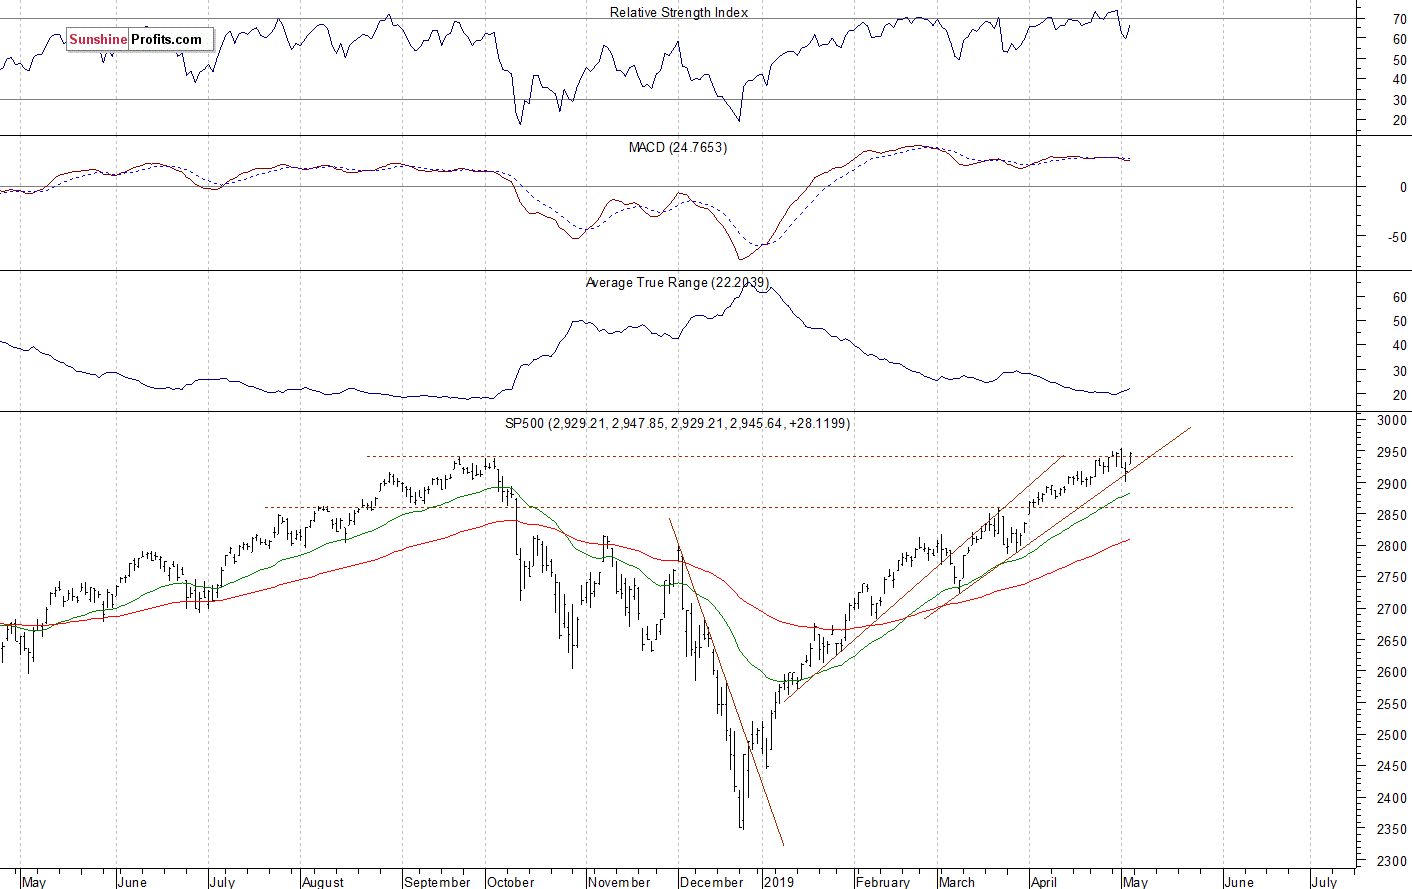
The nearest important resistance level of the S&P 500 index is at around 2,950-2,955, marked by the new record high. The next resistance level is at 3,000. On the other hand, the support level is at 2,915-2,920, marked by the recent resistance level. The support level is also at 2,890-2,900.
The broad stock market retraced all of its December sell-off and it broke above the last year's high recently. There have been no confirmed negative medium-term signals so far. However, the index is trading sideways along its last year's high, as we can see on the daily chart:
Very Negative Expectations
Expectations before the opening of today's trading session are very negative because the index futures contracts trade 1.8-2.1% below their Friday's closing prices. The European stock market indexes have lost 2.0% so far. There will be no new important economic data announcements today. The broad stock market will likely break below its recent local lows this morning. So is this a new downtrend or just a downward correction? For now, it looks like a downward correction. However, if the index breaks below the mentioned support level of around 2,890-2,900, we could see more selling pressure.
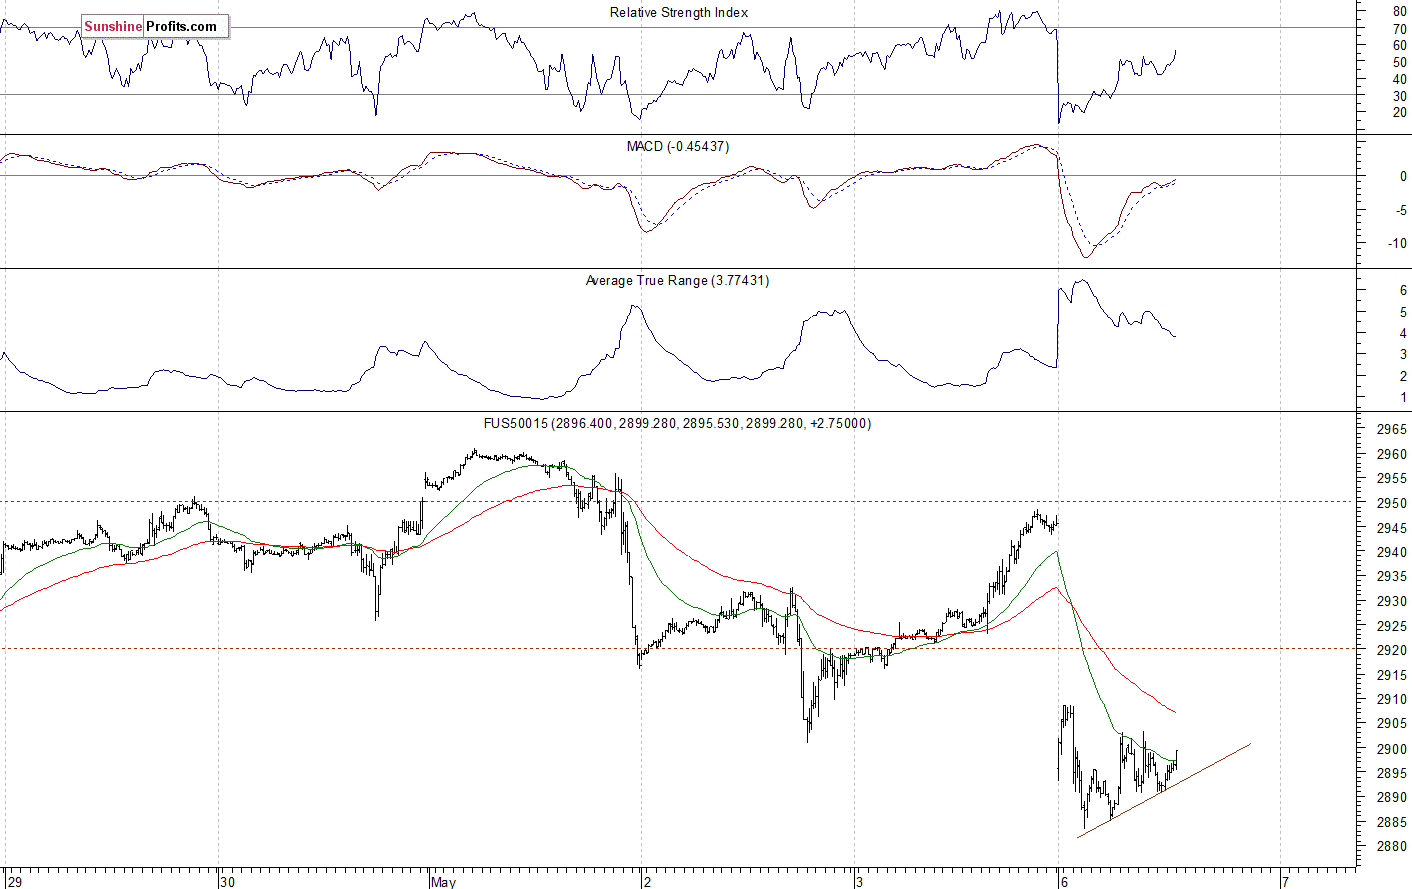
The S&P 500 futures contract trades within an intraday consolidation following an overnight sell-off. The nearest important level of resistance is at around 2,900-2,910. On the other hand, the support level is at 2,885, marked by the local low. The futures contract is now close to the 2,900 mark, as the 15-minute chart shows:
Nasdaq Also Much Lower
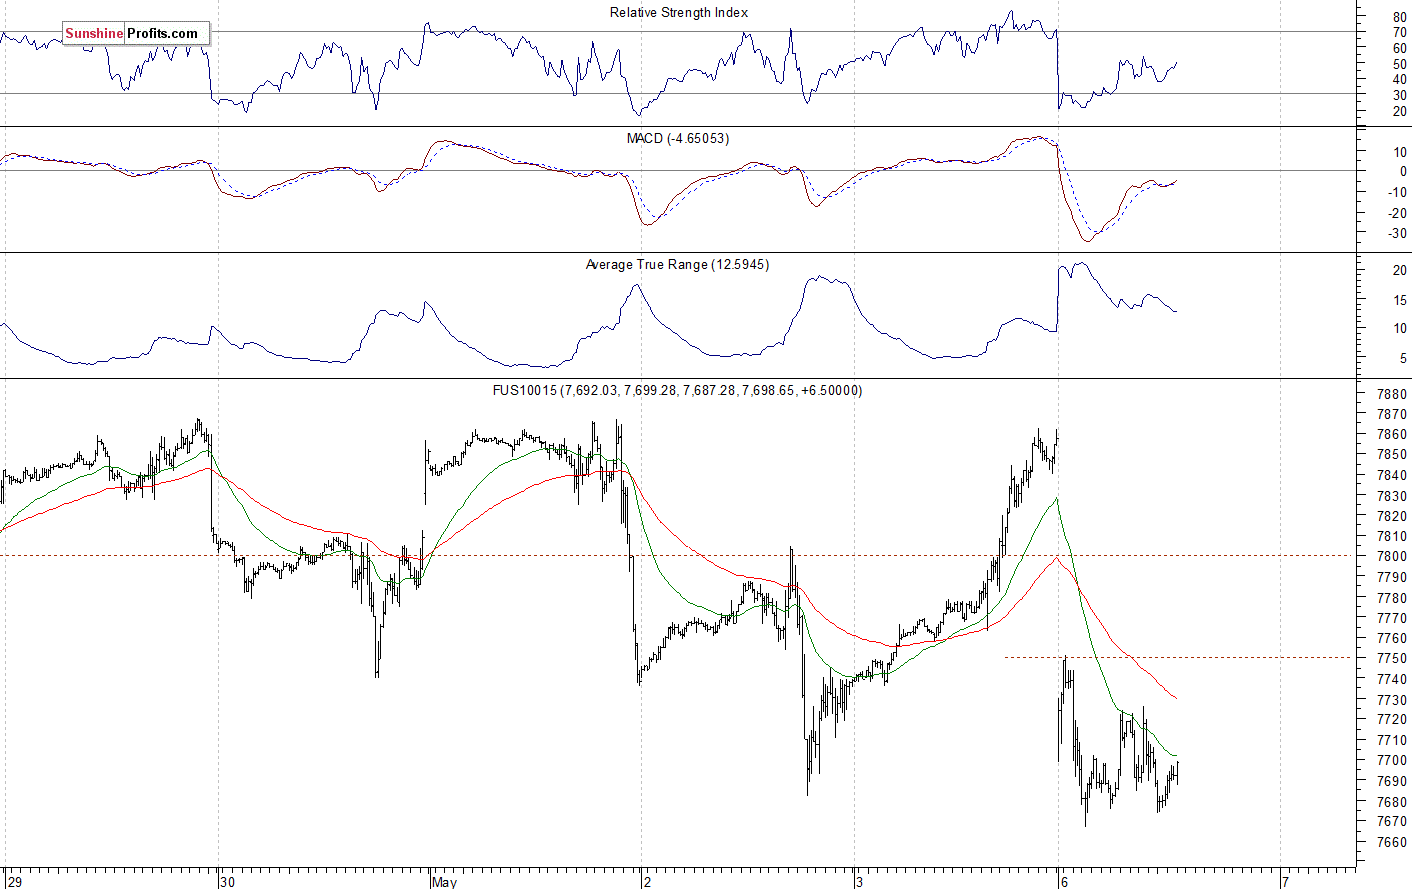
The technology Nasdaq 100 futures contract follows a similar path, as it fluctuates following its overnight sell-off. The nearest important resistance level is at 7,700-7,750. On the other hand, the support level is at 7,650, among others. The Nasdaq futures contract trades along its Thursday's local low, as we can see on the 15-minute chart:
Tech Stocks' Topping Patterns?
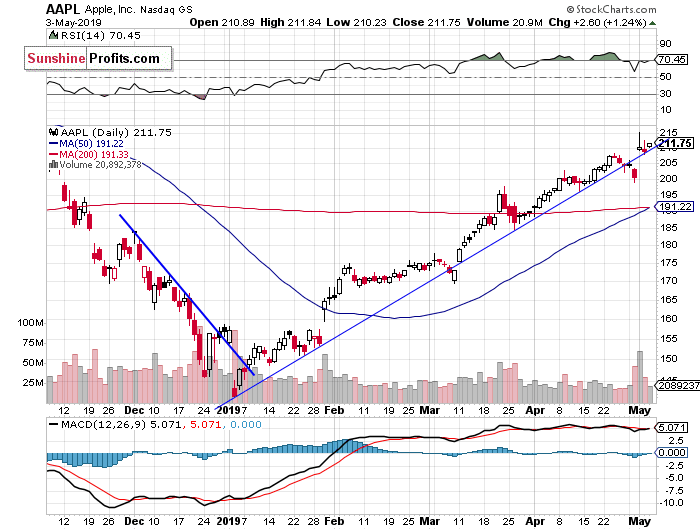
Let's take a look at the Apple, Inc. stock (AAPL) daily chart (chart courtesy of StockCharts). The stock gained almost 5% on Wednesday, following Tuesday's quarterly earnings release. The price got back above the broken medium-term upward trend line again. However, Wednesday's intraday trading action was quite bearish. The resistance level remains at around $215:
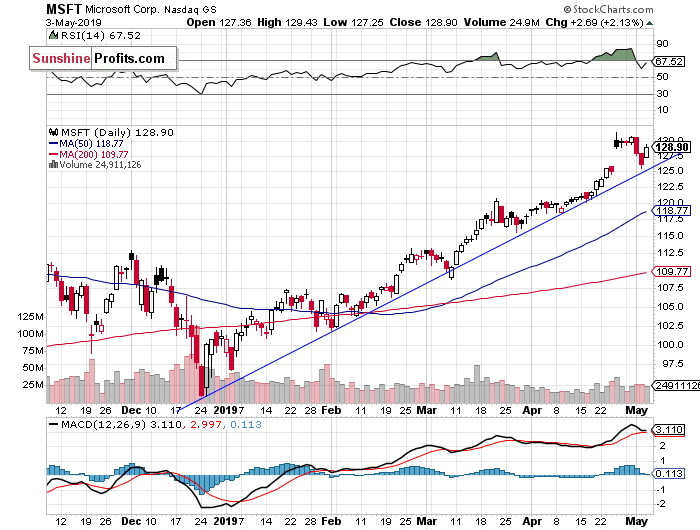
Now let's take a look at the daily chart of Microsoft Corp. (MSFT). The stock accelerated its uptrend recently, as it reached the new record high of $131.37. Investors reacted to a better-than-expected quarterly earnings release. For now, it looks like a blow-off topping pattern. We can see some clear technical overbought conditions:
Dow Jones Remains Close to 26,500
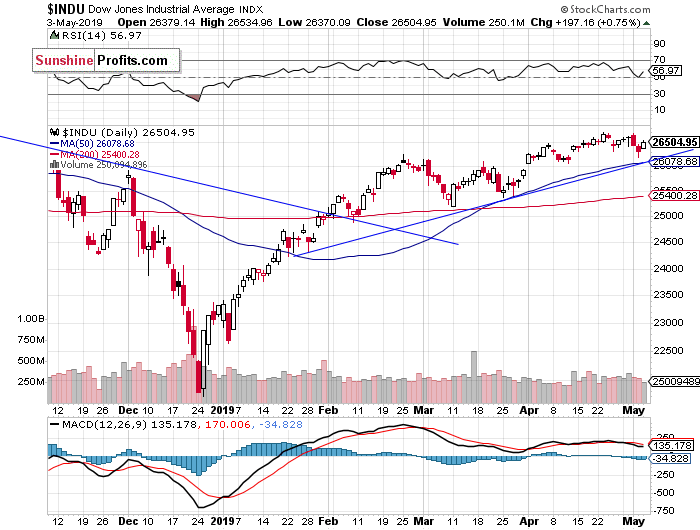
The Dow Jones Industrial Average remains relatively weaker than the broad stock market. The resistance level is still at around 26,800-27,000, marked by the last year's topping pattern and the record high of 26,951.8. Recently the blue-chip stocks' gauge reached the new medium-term high. But then it traded closer to the 26,500 mark again. There have been no confirmed negative signals so far. However, we can see some negative technical divergences:
The S&P 500 index has reached the new record high last week after breaking above the recent local highs. The broad stock market extended its medium-term uptrend, as investors' sentiment remained very bullish following economic data, quarterly corporate earnings releases. However, it is expected to open much lower today following the renewed trade war fears. But then we may see some more short-term volatility both ways.
Concluding, the S&P 500 index will likely open much lower today and it may break below its recent local lows. For now, it looks like a downward correction within a medium-term rally.
Disclosure: None.


