
S&P 500 Forecast: Trying To Break Out
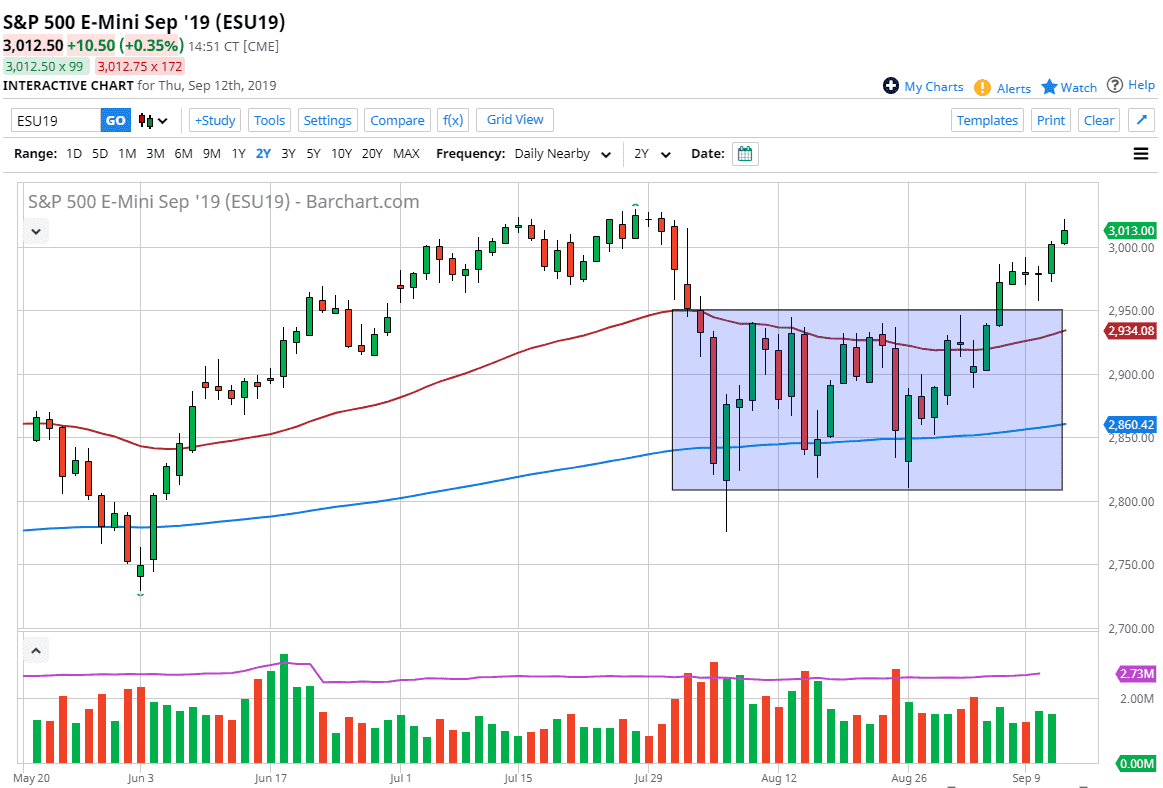
The S&P 500 has rallied a bit during the trading session on Thursday, as we have reached towards new highs but could not break out. By giving back about half of the gains, it looks like we could drop down lower to try to find support in value hunters in this market. This is a market that continues to be driven to the upside due to the optimism of the US/China trade talks, and of course more importantly: the ability of the Federal Reserve to perhaps cut rates. After all, although the market is reacting positively to the newfound optimism of the US/China trade situation, remember that the most important thing for stock markets is going to be whether or not the Federal Reserve is cutting rates or not.
As they loosen monetary policy that does help a risk appetite situation, and therefore the S&P 500 rallies. If we can break out to a fresh, new high then it’s likely that we go looking towards the 3100 level based upon the consolidation area that I have marked on the chart and would fulfill a potential measured move. To the downside though, if we were to pull back the red 50 day EMA is very supportive, just as the previous resistance at the 2950 level should be as well.
Ultimately, if we do break above the top of the candle stick from the trading session on Thursday and then eventually hitting a fresh, new high, then it’s likely that a lot of money will go flushing into this market and pushing it much higher. I think that at this point we are paying attention to bond yields, the US/China trade situation, any ideas as to what the Federal Reserve is going to be going next as liquidity becomes the paramount concern, and that of course at that point we will start to focus on the actual underlying economy.
The market has been bullish for a couple of weeks, but it also is a bit overbought, so at this point in time a pullback makes quite a bit of sense, but also there are a lot of buyers underneath looking to avoid missing out on the longer-term momentum. However, if we were to break down below the 50 day EMA, then the market breaks down significantly towards the 200 day EMA which is trend defining as per usual.
(Click on image to enlarge)
Disclaimer: DailyForex will not be held liable for any loss or damage resulting from reliance on the information contained within this website including market news, analysis, trading signals ...
more

