
S&P 500 Eyes Breakout Even As Nasdaq 100 Acts Weak And Russell 2000 Lies In Between
Major US equity indices are diverging. The S&P 500 is itching to once again break out, even as the Nasdaq 100 acts tentative. Tech has suffered technical damage, and without the sector’s participation, it is hard to imagine the S&P 500 continuing its run.
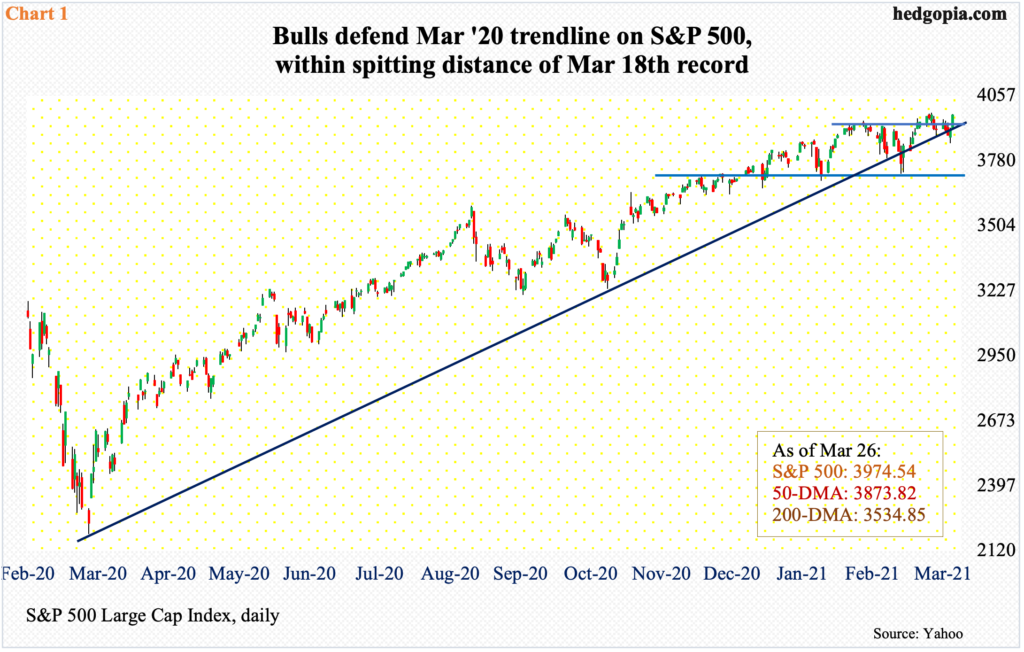
The S&P 500 could be itching to break out. It has essentially gone sideways at 3950s the last six weeks. On February 16, the large cap index retreated after printing 3950.43. It then dropped 5.7 percent intraday over 13 sessions, closing below the 50-day for one session. Selling stopped at 3720s (Chart 1).
The rally from that low surpassed the prior high on March 17 as the index tagged 3983.87. Then in seven sessions intraday, it shed 3.3 percent. Last Thursday, the average was once again breached but the only intraday. In the last couple of months, this was the third time the 50-day was used as an opportunity to buy.
From last Thursday’s low, the S&P 500 (3974.54) already rallied 3.2 percent – slightly past 3950s. The March 17th high is just a stone’s throw away. A rising trend line from last March has been defended – again. Friday finished strong – for a daily marubozu.
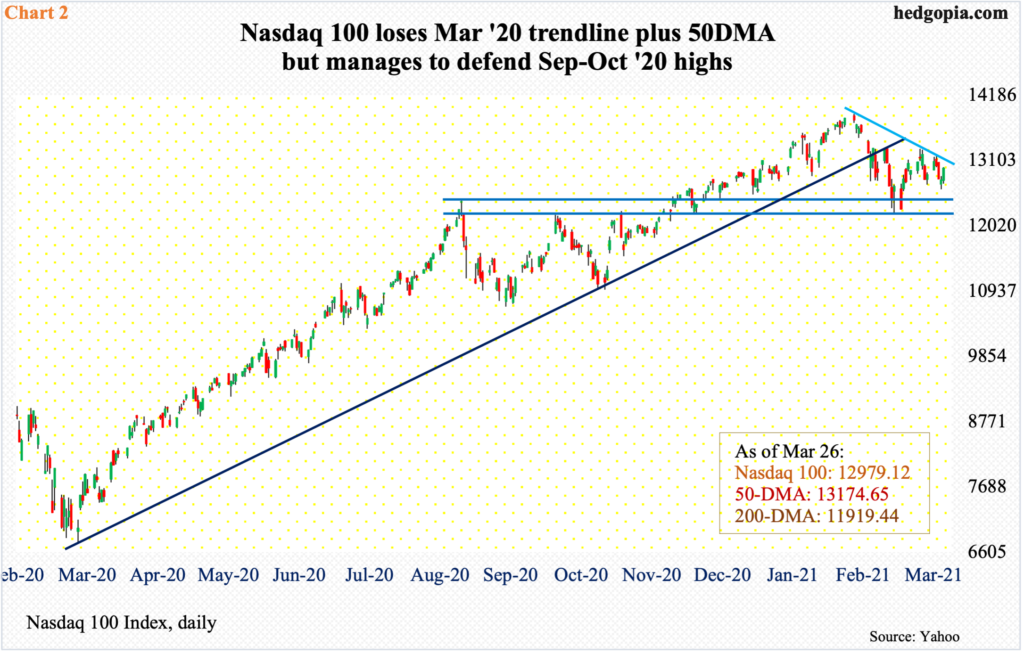
That trend line on the Nasdaq 100 has been breached, however. It was lost over a month ago. As did the S&P 500, the tech-heavy index peaked on February 16 at 13879.77. Then, through the March 5th low, it quickly dropped 12 percent – below the trend line as well as the 50-day. The rally since – unlike the S&P 500 – was unable to recapture the 50-day, forget rising to a new high.
From bulls’ perspective, the good thing is that the highs from last September-October – between 12200s and 12430s – has been defended. But the index (12979.12) remains under the 50-day and does not quite act healthy. One can sense this comparing Chart 2 with Chart 1.
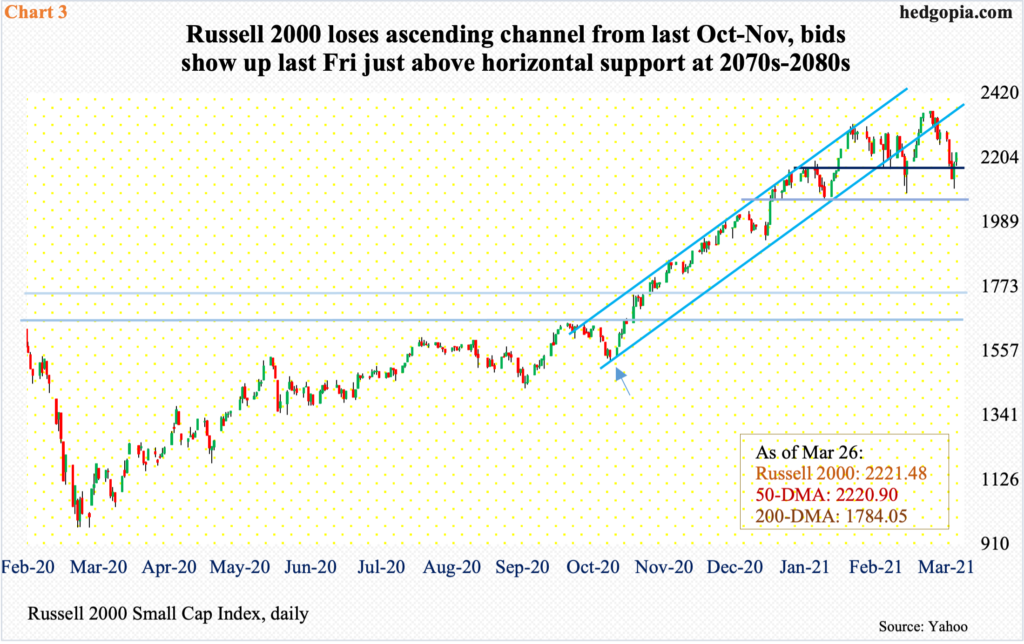
Similarly, the Russell 2000 has lost a rising channel from last October-November. The small-cap index (2221.48) has come a long way since last March when it bottomed at 966.22 (Chart 3). But the channel in question probably holds more significance in small-caps’ case.
By nature, small businesses have more domestic exposure than their larger brethren, which are also exposed internationally. Small-caps made an important bottom around the time of the last presidential election (arrow in Chart 3). Then on November 9, Pfizer (PFE) came out with its positive vaccine announcement, followed by Moderna’s (MRNA) a week after that. Investors soon began to price in an economy that would begin to open up, with things getting back to normal. In short order, the Russell 2000 broke out of 1600-plus and then 1740s, which was its prior high from August 2018.
On February 10, the Russell 2000 retreated after posting 2318.09. The drop since found support at the 2070s-2080s. The rally after that low made a new high, but not by much, as the index once again retreated after tagging 2360.17 on the 15th this month. Once again, that support was just about tested – successfully – as last Thursday’s low of 2100.27 was bought. Friday, the index essentially closed on the 50-day.
In essence, the Russell 2000 does not act as weak as the Nasdaq 100 but not as strong as the S&P 500. Last March, the small-cap index bottomed in the midst of all the gloom and doom. This March, sellers are having the upper hand as the US economy is expected to boom this year.
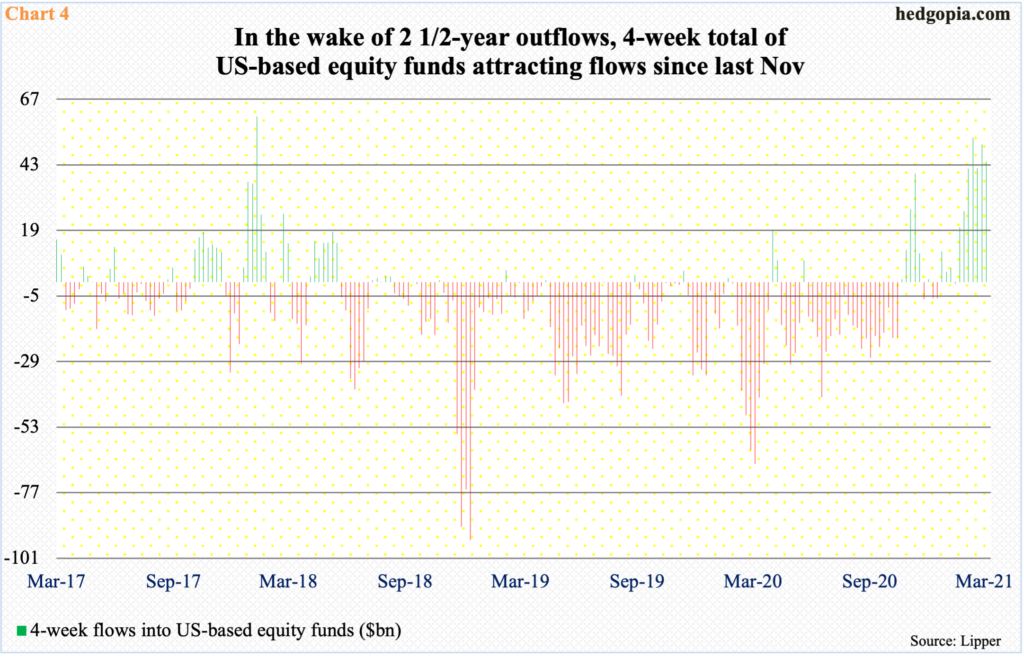
These three indices are going their own way even as flows have picked up momentum in recent weeks. Since the week to February 10 through last Wednesday – which is seven weeks – US-based equity funds took in $96.9 billion, including $10.9 billion in the latest week (courtesy of Lipper).
Chart 4 uses a four-week total and the trend decisively improved beginning last November. Before this, outflows prevailed for two and a half years. At least some of this was in all probability utilized last Friday when the S&P 500 shot up 1.7 percent, the Nasdaq 100 1.6 percent, and the Russell 2000 1.8 percent, propelled by the last hour when they respectively jumped one percent and 1.4 percent each.
Follow-through will be more than welcome. Going by the divergence among these three indices, the S&P 500 is where new money is likely to gravitate. Hence the odds of a breakout. This may change anytime, but right here and now, this is how fast money likely trades.
One thing going for bulls – if it can be called that – is that some of the overbought conditions is being corrected through time.
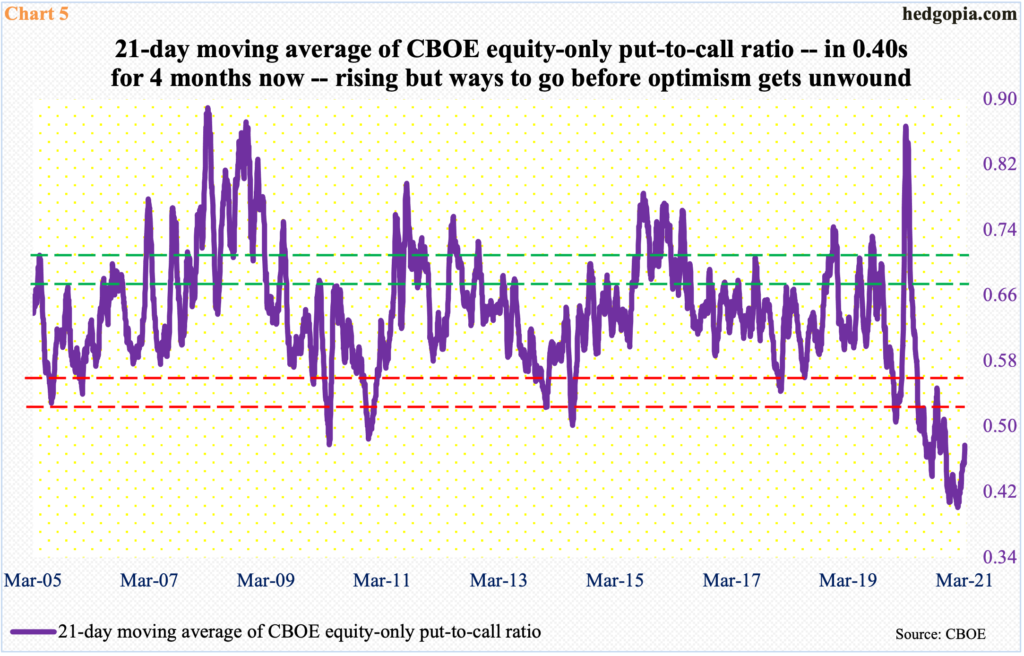
In the options market, the 21-day moving average of the CBOE equity-only put-to-call ratio made an all-time low of 0.401 on February 10, before rising. Recall that all three indices above peaked around that time. Both the S&P 500 and the Russell 2000 then went on to surpass those highs, but the ratio kept rising, with last Friday at 0.477 (Chart 5).
Longer-term, this is not much of solace for the bulls, as there is a long way to go before the built-in optimism is taken care of. Historically, this occurs once the ratio reaches high-0.60s to low-0.70s.
Secondly, once again, the ongoing unwinding is not impacting stocks uniformly. It is tracking the Nasdaq 100 more than the S&P 500.
This divergence has to end if the S&P 500 wants to (1) break out and (2) shift into a higher gear. The leading tech outfits play too big of a role in market cap-weighted indices. The top six – Apple (AAPL), Microsoft (MSFT), Amazon (AMZN), Alphabet (GOOG/L), Tesla (TSLA), and Facebook (FB) account for 44 percent of QQQ (Invesco QQQ Trust) and 23 percent of SPY (SPDR S&P 500 ETF).
For a rally to sustain, tech has to take part. Immediately ahead, bulls’ test is if they can decisively reclaim the 50-day on the Nasdaq 100, which is merely 1.5 percent away. Arguably, this can force shorts to cover.
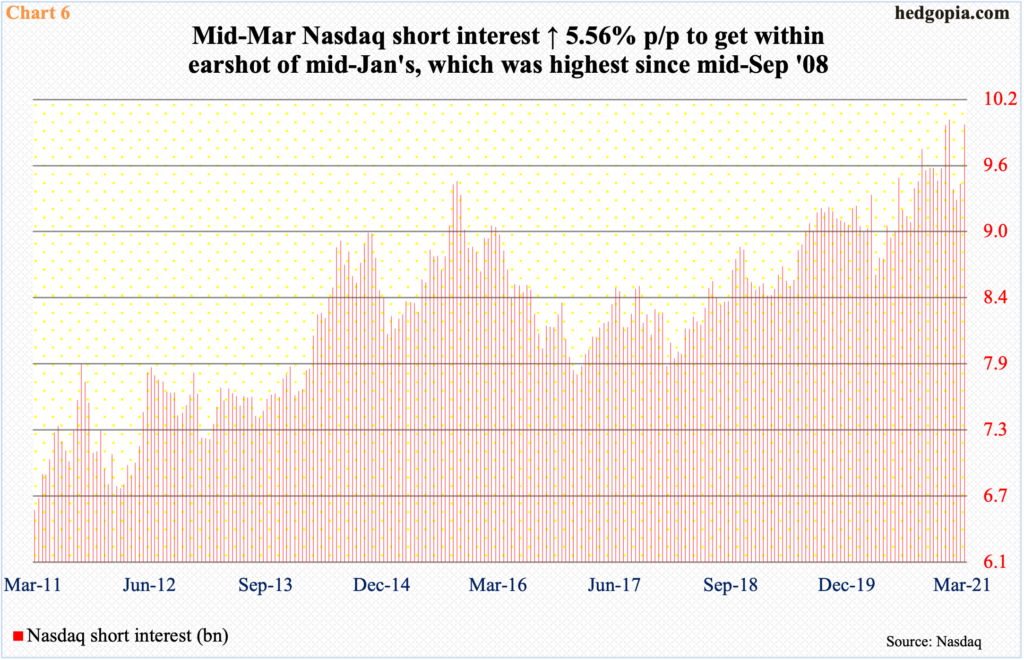
Time and again in the past, zealous shorts ended up helping the longs as they cover. They have accumulated tons of exposure on the short side. Mid-March, Nasdaq short interest increased 5.6 percent period-over-period to 10 billion, essentially on par with mid-January’s, which was the highest since mid-September 2008 (Chart 6). There are enough non-believers out there.
For them to at least begin to cover, let alone convert into longs, the latter need to repair the technical damage that the sector has suffered – the sooner the better. This is coming at a time when buybacks by information technology companies have dried up – relatively, that is.
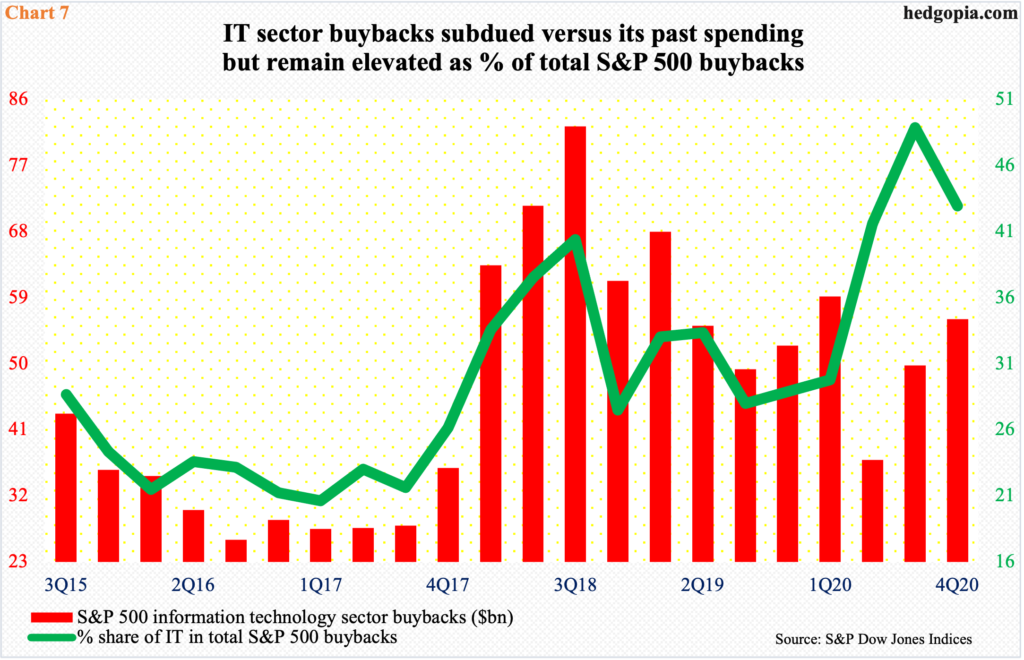
In 2Q20, in the wake of the February-March selloff, the sector’s buybacks dropped to as low as $36.9 billion, which was the lowest since 4Q17. Buybacks have improved since, with 4Q20 hitting $56.1 billion but this still pales in comparison to the $82.3 billion recorded in 3Q18 (Chart 7). As a percent of the S&P 500 total, IT buybacks still command a high share but have weakened meaningfully on an absolute basis.
On a longer timeframe, this will matter, as buybacks provided a massive tailwind in 2018 and 2019 in particular. Right here and now, as far as the tech sector is concerned, it is unlikely buybacks pick back up anytime soon. So, help – if any – will have to come from other sources, including margin debt and fund flows. A lack thereof should continue to put the sector on the back foot, and this in due course reverberates through the S&P 500, near-term notwithstanding.


