
SP 500 Earnings Update & Economic Data Review
(Click on image to enlarge)

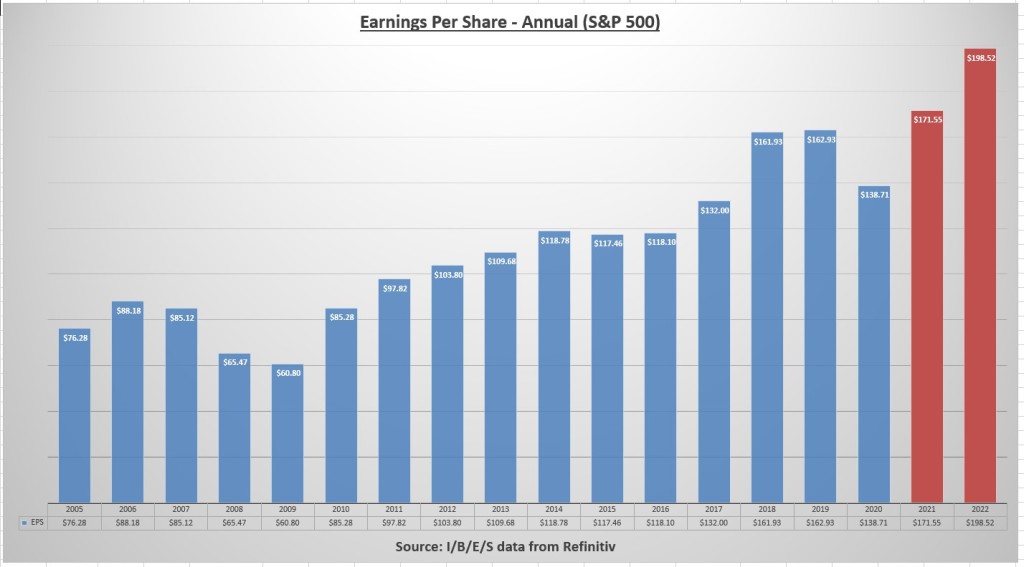
The earnings per share for all S&P 500 companies combined increased to $171.33 last week.
(Click on image to enlarge)
The forward EPS has increased 8% in the last 4 weeks, and 2021 EPS estimates are now 5.3% above 2019.
Q4 earnings reports continue to be stellar compared to expectations. As of Friday, about 37% of the S&P 500 has reported Q4 results. 84% of those companies have beaten expectations, coming in a combined 17.3% above expectations. (I/B/E/S data from Refinitiv)
(Click on image to enlarge)

The S&P 500 declined -3.31% last week.
(Click on image to enlarge)

A combination of increased earnings and a decline in price, pushes the price to earnings (PE) ratio down to 21.7x.
(Click on image to enlarge)

The earnings yield on the S&P 500 improved to 4.61%, while the 10 year treasury rate increased to 1.093%.
(Click on image to enlarge)
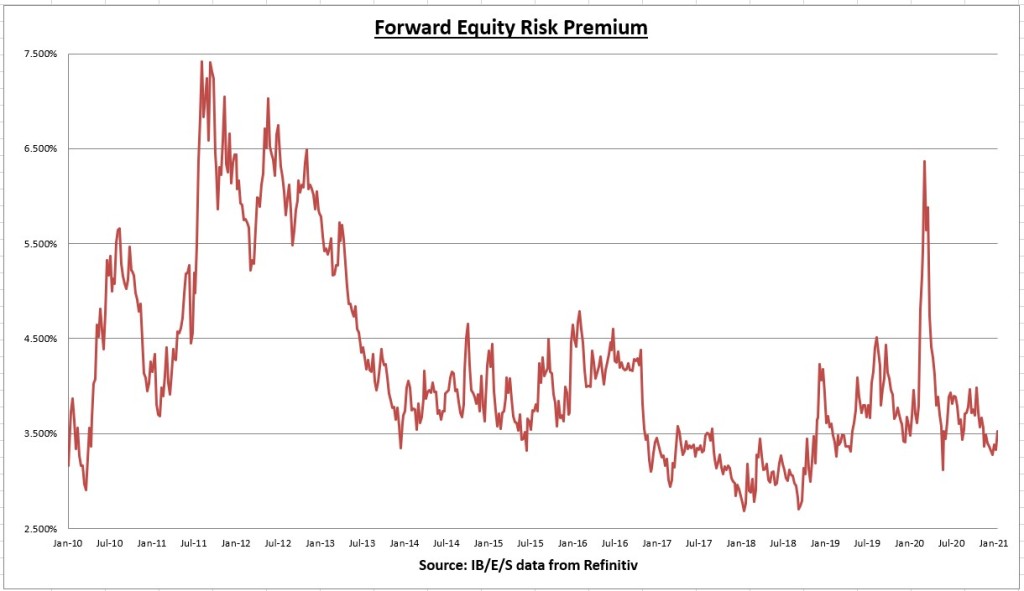
The earnings yield increased more than the 10 year treasury bond rate, pushing the equity risk premium (earnings yield minus risk free rate) up to 3.52%.
Economic data review
(Click on image to enlarge)

January Consumer Confidence came in at 89.3, +2.5% above the December’s downwardly revised 87.1. Unfortunately, consumer confidence remains near the pandemic lows and sharply lower than the February 2020 high point of 132.6.
(Click on image to enlarge)

This months reading is down -31.5% from last year.
With weekly unemployment and continued claims worse than they were during the 2008 financial crisis, this shouldn’t come as a surprise. Interestingly, consumer expectations for future conditions improved, per the CB report, “The percentage of consumers expecting business conditions will improve over the next six months increased from 29.5 percent to 33.7 percent, while those expecting business conditions will worsen decreased from 22.0 percent to 18.1 percent. The proportion expecting more jobs in the months ahead increased from 28.0 percent to 31.3 percent, while those anticipating fewer jobs decreased from 22.2 percent to 21.4 percent.”
This is in contrast to the small business optimism report last month, where small business managers expectation for future business conditions over the next 6 months fell sharply.
(Click on image to enlarge)

December New Home Sales came in at 842,000. This is an increase of +1.57% over the prior month (which was revised down to 829,000) and an increase of +18.93% over last year.
(Click on image to enlarge)

We also got our first look at Q4 GDP. The economy grew an inflation adjusted 4.0% for the quarter (missing expectations) to $18.78 trillion. The economy has now retraced about 76% of the COVID decline on an inflation adjusted basis.
(Click on image to enlarge)

Real GDP shows the economy declined 3.5% in 2020. The worst annual decline in 74 years (1946: -11.6%). We get two more updates to Q4 GDP over the coming months. So it’s possible the final numbers could get better (or worse). Average annual real GDP since 1930 is +3.25%.
Notable earnings reports
(Click on image to enlarge)
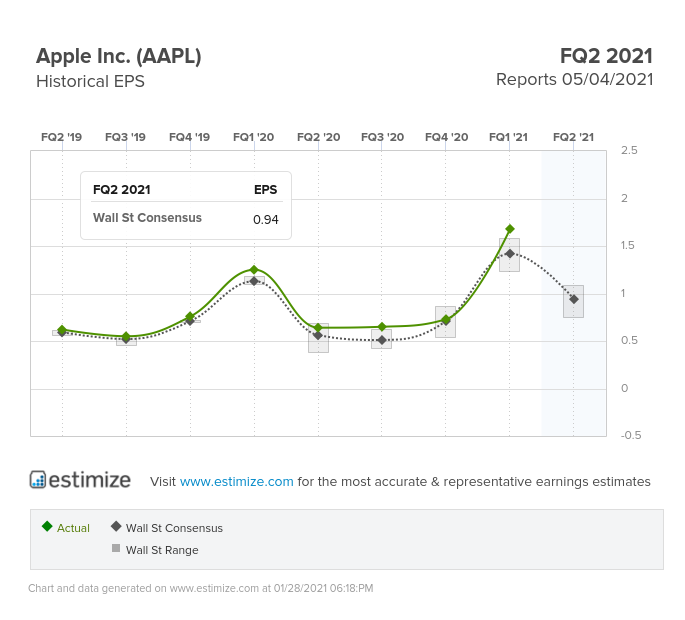
Apple Inc (AAPL) beat earnings and revenue estimates, reporting a record $111.439 billion in revenue for the quarter (+21% over last year). Most companies don’t generate $100+ billion in revenue for an entire fiscal year. Truly amazing! Strong growth along each product segment, with record iPhone revenues generated despite the supply constraints. Adjusted EPS grew +35% over last year.
(Click on image to enlarge)
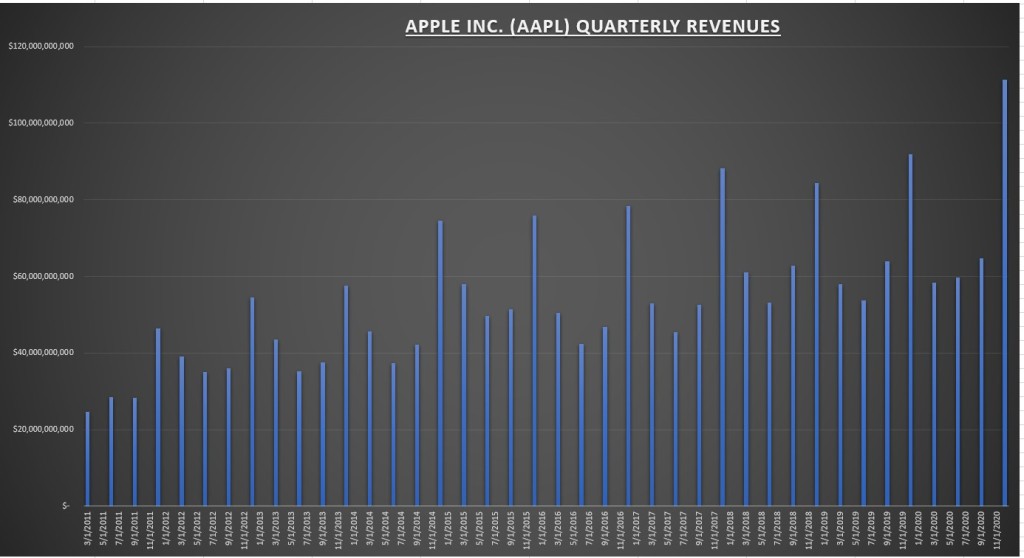
AAPL QUARTERLY REVENUES
Services revenue grew 24% and increased to 14.14% of sales.
Gross margins improved from 38.4% to 39.8%
Operating margins improved from 27.8% to 30.1%
A strong report all around and I don’t think its over yet. Although at 32x forward earnings, a lot of good news is already in the stock.
(Click on image to enlarge)
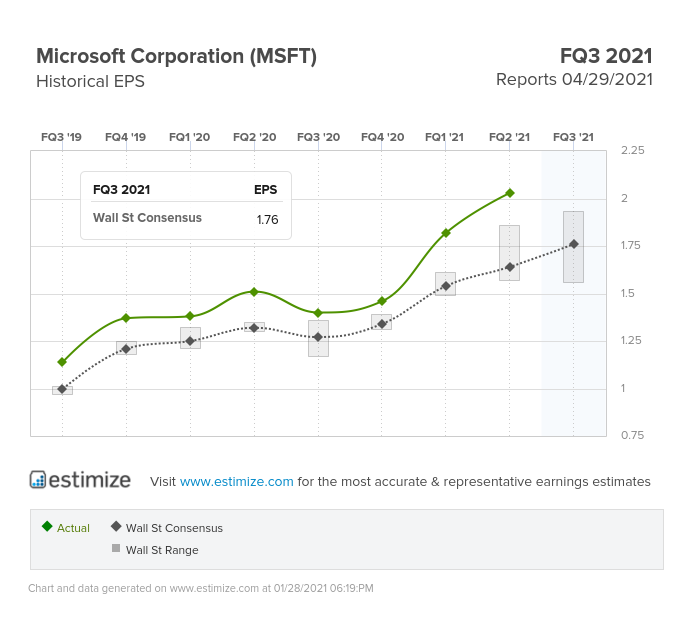
Microsoft (MSFT) also reported a record quarter. They beat earnings and revenue estimates handily, reporting +34% adjusted EPS growth, and +17% revenue growth. Led by strong growth in cloud (Azure revenue growth of 50%).
(Click on image to enlarge)
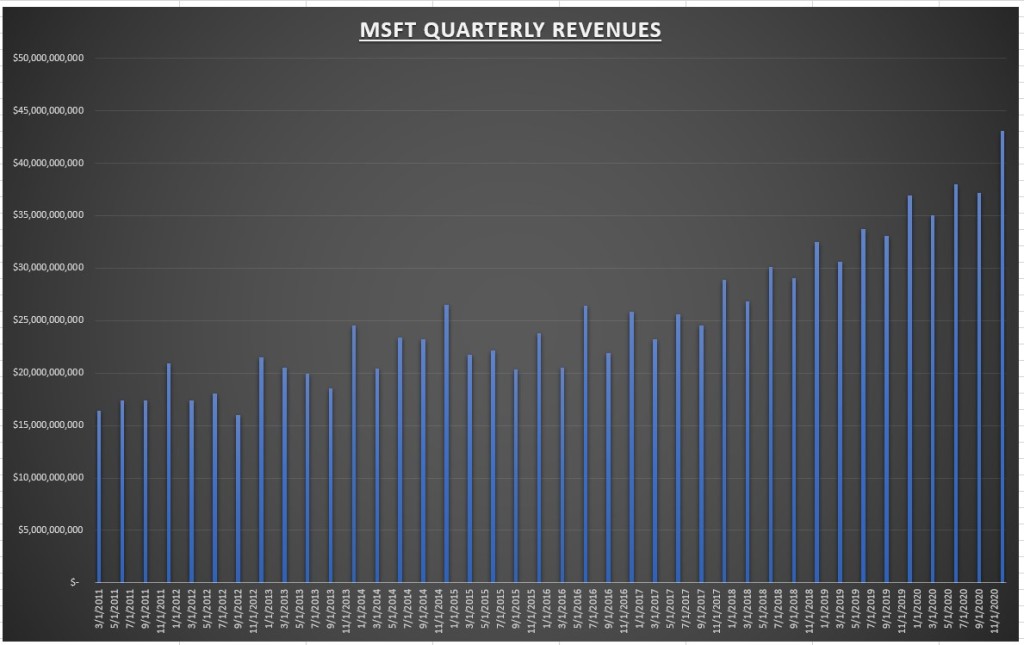
Record quarterly revenues of $43.1 billion.
(Click on image to enlarge)

And record net income of $15.5 billion.
Gross margins improved to 67.05%
Operating margins improved to 41.55%
Profit margins improved to 35.90%
Two solid reports from two of the biggest companies in the S&P 500. I’ve owned both for many years with no intentions to sell. Would add to both on any market correction.
No, we aren’t in a bubble
(Click on image to enlarge)

The bubble talk was out in full force again last week. We’ve heard the same argument for the last decade. In the post 2008 world, every time the market makes a new high its a bubble, and every time we have a normal bad day its a free fall (CNBC’s big red headline of “Stocks Plunge” after Friday’s 2% decline was the perfect example. It’s as ridiculous as its irresponsible.)
The above chart shows the rolling 20 year annualized returns for the S&P 500 since the 1928 – 1948 20 year window. Despite good returns since 2009, the rolling 20 year annualized return rate is 8.07%, which is near the lower end of the historical range. To everything there is a season. A decade of poor market returns set the stage for a period of solid performance. Remember the market didn’t make a new all time high again until 2013. So about 5 years of the bull market that began in 2008, was spent recovering what was lost during the crash. Technically, the secular bull market didn’t really begin until 2013.
Yes, there is clearly a bubble in some stocks and areas of the market. But no, the overall market is not in a bubble. Even though we had two bubbles in a short time span (2000 and 2008), financial market history shows bubbles are actually quite rare. There is a difference between an overvalued market and a bubble. You can make a case the market is currently overvalued, but the bubble argument falls short when you adjust for current interest rates. I expect strong earnings growth over the next two years to push the price to earnings (PE) ratio back to a more reasonable level. Markets anticipate stronger earnings, and then grow into those earnings over time.
Yes, the Fed is manipulating rates. But even if the 10 year treasury bond went up to 3%, stocks would still be reasonably priced with an earnings yield of 4.61%. The year 2000 was a real bubble, the 10 year treasury bond rate was 6.20% while the earnings yield was only 3.68%. Meaning the equity risk premium was negative. Stay disciplined and don’t fall for the scare mongering. Stocks can go up without it becoming a bubble, and they can go down without it turning into a crash.
Summary: Lost in the middle of this weeks market volatility is a slew of record earnings reports (and record beat rates) along with persistently low risk free interest rates. Nothing that transpired this week changes any of that. In fact, the fundamentals have only improved as valuations got cheaper while dividend & earnings yields increased.
Last week I included the charts showing the S&P 500 was trading above its 200 day and 200 week averages by a near record amount. The market is a bit overstretched in the short term. A pullback to the vicinity of the 50 week moving average would be healthy. All we can do is take what the market gives us. I build up my cash reserves during rising markets, and then deploy that cash into the market during the fire sales.
This week, another 115 companies report Q4 earnings. And for economic data we have the ISM Services & Manufacturing PMI’s along with the January employment report. It will be another busy week!
Disclaimer: None.


