
S&P 500 Earnings Update & Economic Data Review - How Stocks Perform When Rates Rise Sharply

The earnings per share (EPS) for all S&P 500 (SPX) companies combined increased to $174.19 this week. The forward EPS has grown 9.54% so far this year.
95.8% of S&P 500 companies have now reported Q4 results, 80% of those companies have beaten expectations and earnings have come in a combined 16.5% above estimates. (I/B/E/S data from Refinitiv)

The S&P 500 declined -2.45% for the week.

The increase in EPS along with the decline in the S&P 500 pushes the price to earnings (PE) ratio down to 21.9

The big news was the move in rates. The 10 year treasury bond rate blew threw resistance levels with ease this week, settling back above pre-COVID range.

While the 10 year treasury bond rate increased about 11 basis points (to 1.46%) this week, the earnings yield on the S&P 500 actually increased 12 basis points (to 4.57%).

The equity risk premium (earnings yield minus 10 year treasury rate) actually improved this week despite the sharp rise in rates, due to the increase in EPS and decline in price.
Economic data review

The Conference Board’s Leading Economic Indicators (LEI) came in at 110.3 for January. An increase of +0.55% over Decembers number which was revised to 109.7. Per the CB:
“While the pace of increase in the U.S. LEI has slowed since mid-2020, January’s gains were broad-based and suggest economic growth should improve gradually over the first half of 2021,” said Ataman Ozyildirim, Senior Director of Economic Research at The Conference Board. “As the vaccination campaign against COVID-19 accelerates, labor markets and overall growth are likely to continue improving through the rest of this year as well. The Conference Board now expects the U.S. economy to expand by 4.4
percent in 2021, after a 3.5 percent contraction in 2020.”
Should the economy actually expand 4.4% in 2021, that would be the highest annual growth rate since 1999 (+4.8%).

Consumer confidence for February came in at 91.3, slightly above expectations and an increase of +2.7% above January (which was revised down from 89.3 to 88.9). Still, the index is down 33% below the July 2019 all time high and down 31% year over year.
The present situation index – based on consumers assessment of current business and labor market conditions – increased 7.6% for the month, while the expectations index – based on consumers short term outlook for income, business, and labor market conditions – showed a modest decline of 0.44%.
“After three months of consecutive declines in the Present Situation Index, consumers’ assessment of current conditions improved in February,” said Lynn Franco, Senior Director of Economic Indicators at The Conference Board. “This course reversal suggests economic growth has not slowed further. While the Expectations Index fell marginally in February, consumers remain cautiously optimistic, on the whole, about the outlook for the coming months. Notably, vacation intentions—particularly, plans to travel outside the U.S. and via air—saw an uptick this month, and are poised to improve further as vaccination efforts expand.”
It took about 10 years for confidence to return after the 2008 financial crisis, so these shocks to the system can take time to recover from.
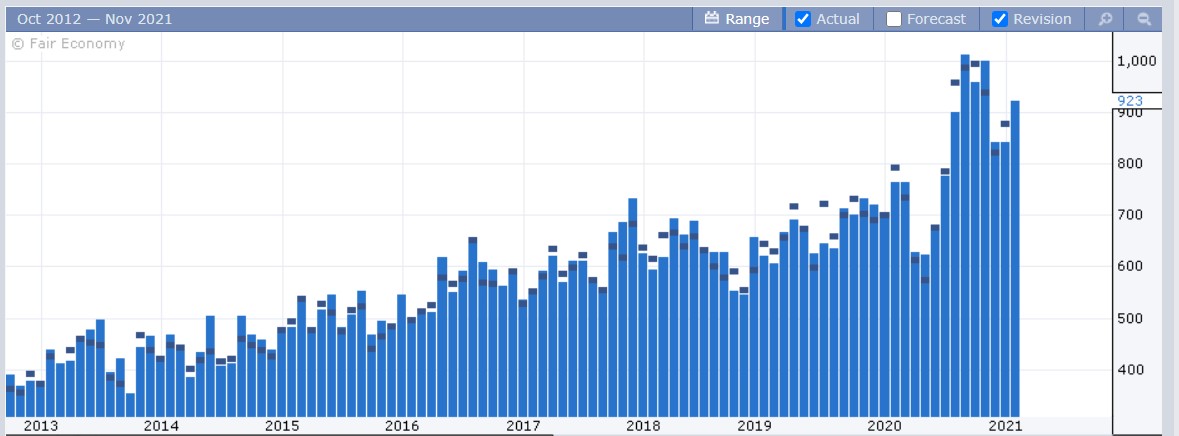
January new home sales came in at 923,000, which was well above expectations and +4.3% above December (which was revised up from 842,000 to 885,000. New home sales are up +15.4% annually.

We got our second look at Q4 GDP this week. The economy grew +4.1% in Q4 on an annualized basis (up from +4.0% in the first estimate). The economy has recovered about 76% of the COVID recession losses on an inflation adjusted basis.
Q1 2021 GDP estimates continue to be revised upwards and range from about +4% to as high as +9.5%.
Notable earnings reports
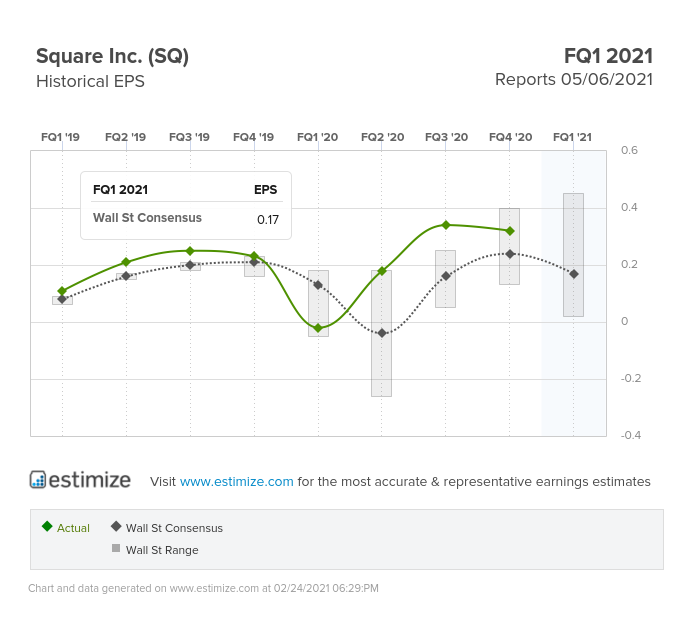
Payment services company Square (SQ) reported an adjusted EPS of $0.32 (y/y growth rate of 40% and beating estimates) on revenue growth of 141%.
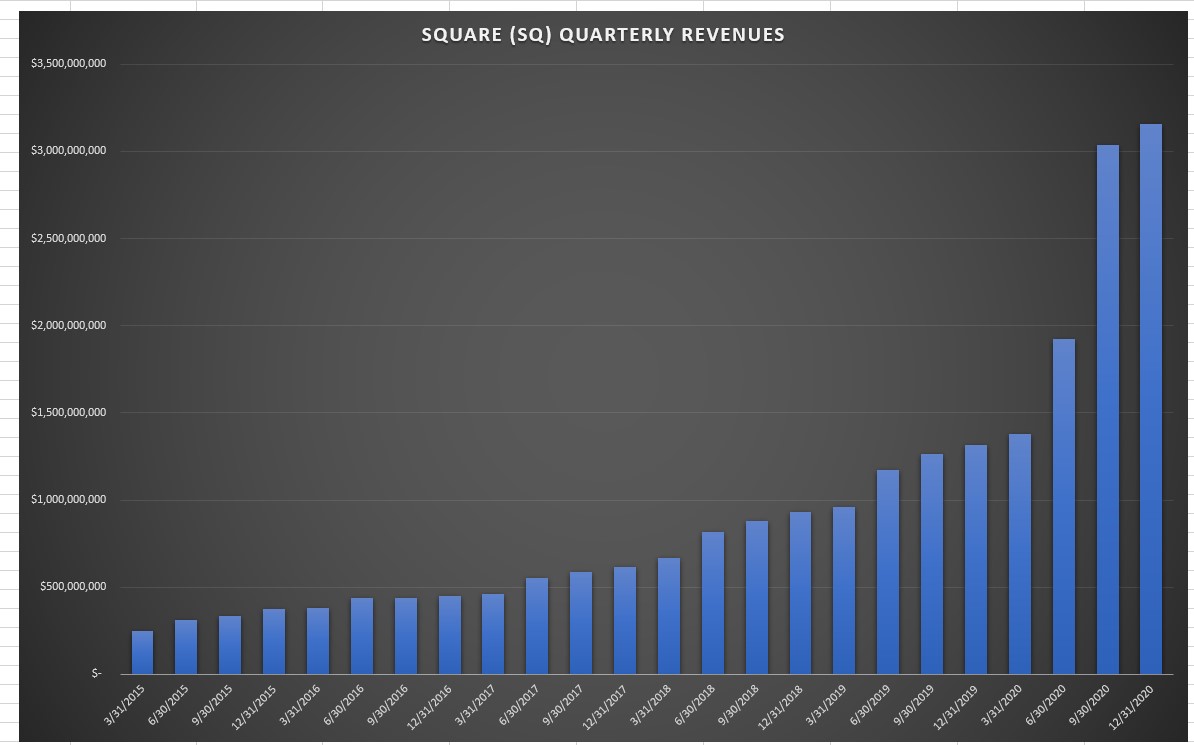
It was another quarterly record for the company but digging into the numbers show a large part of the growth came from Bitcoin revenues. Bitcoin (bitcomp) revenues in Q4 2019 were 13.5% of total sales, and has grown to 55.5% of total sales in Q4 2020. I’m not sure how dependable that is.
Subtract bitcoin revenues and the revenue growth rate goes from +141% to +23.5%. The company also announced an additional purchase of bitcoin, which brings its total investment to about 5% of the companies cash and cash equivalents.
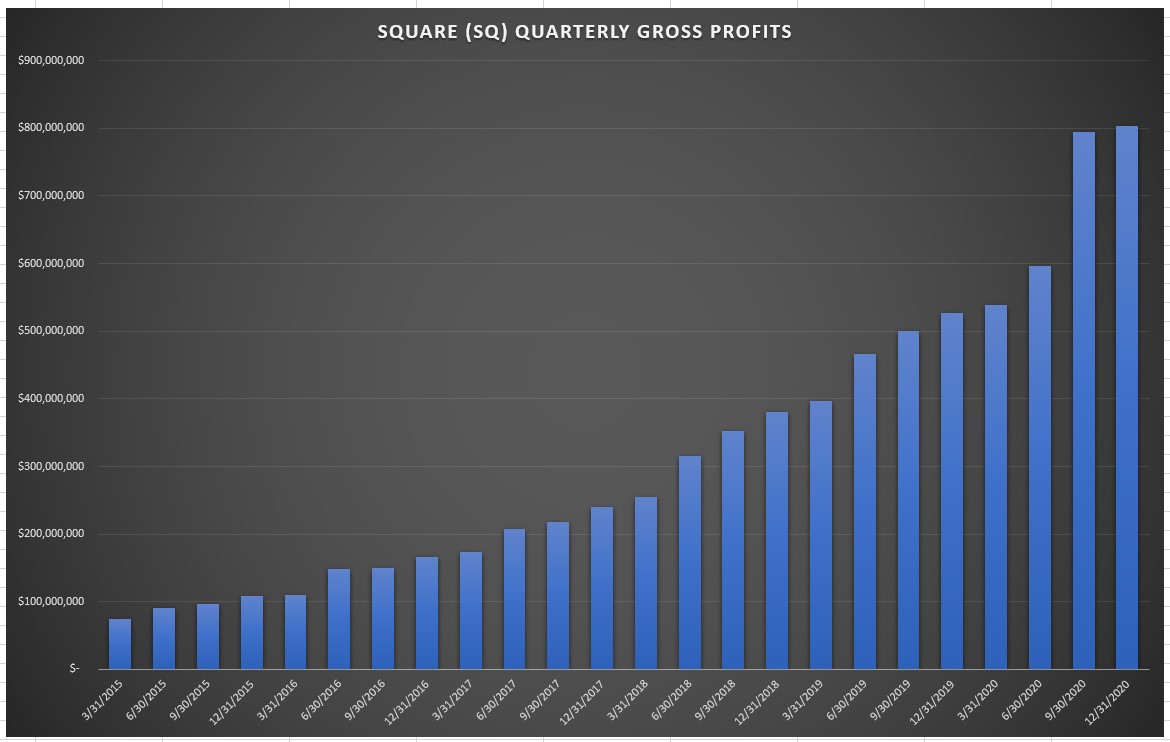
Gross profits grew to $803 million (y/y growth rate of +52.5%), but gross margins deteriorated on both a sequential and year over year basis. Gross margins declined from 40% in Q4 2019 to 25% in Q4 2020. This is because bitcoin revenues are a very low margin segment (total bitcoin revenues were $1.756 billion while bitcoin related costs came to $1.715 billion, representing a gross profit margin of 2.32%).
Total gross payment volumes grew 11.8% year over year, while Cash App monthly active customers grew 50% year over year. Cash app now has 36 million monthly active customers.
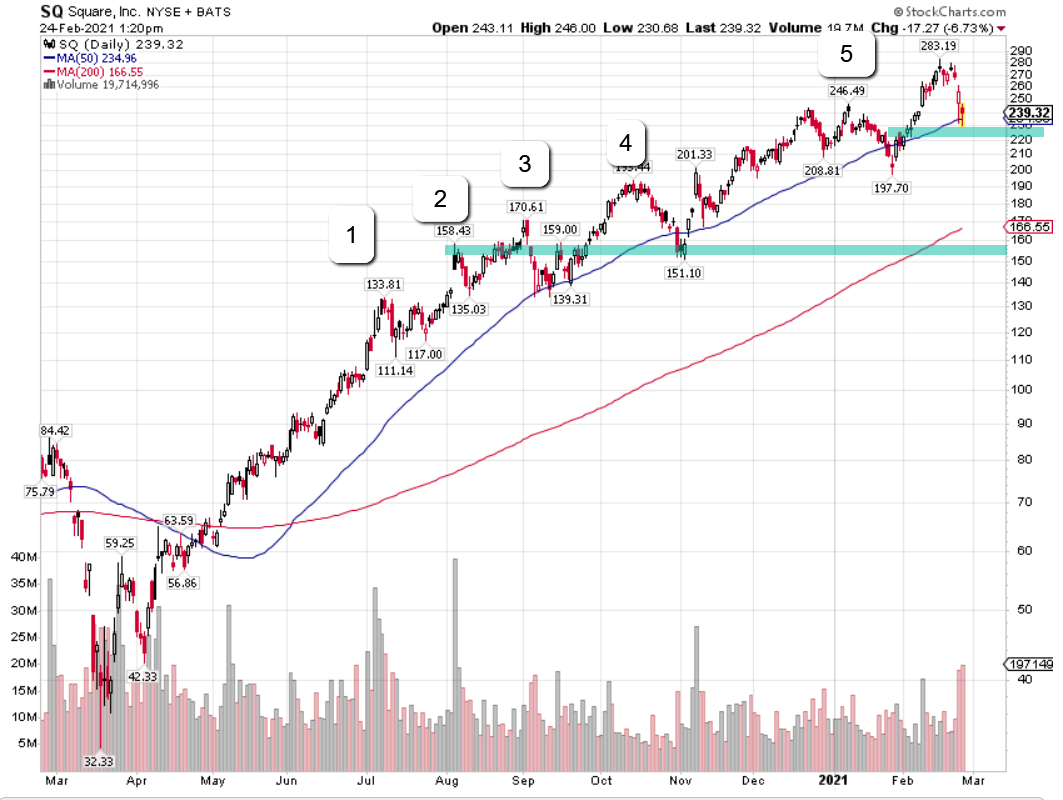
It was a good report overall but I think it left more questions than answers. Square’s bitcoin involvement makes it more volatile. I’ve maintained a small position for years, I like the growth potential and it barbells my positions in traditional banks. The above chart shows the pattern of pullbacks ranging in the 20% range over the last year. The stock is off close to 20% from its all time high and trades near the 50 day moving average, which could provide support. If the pattern fails, I’d look for support around the high $150’s (which is the high volume gap up day August 5th) if it got there. No intentions to add but if $150 traded I could be persuaded.
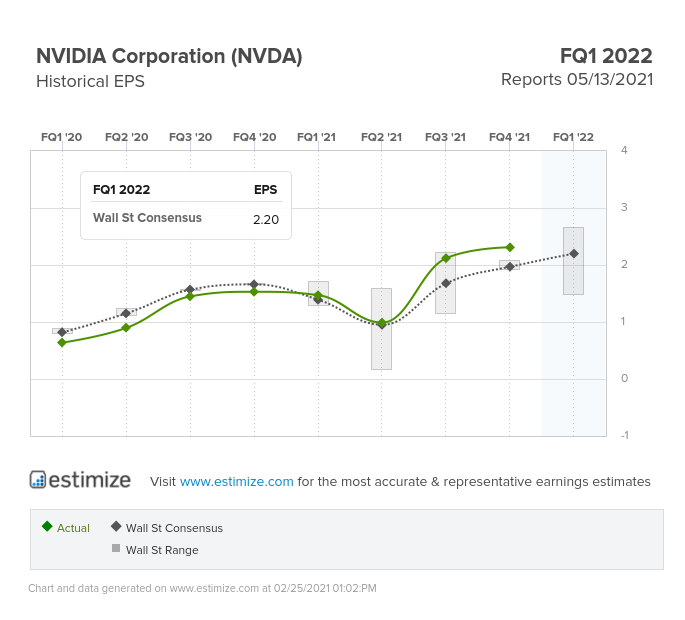
Nvidia (NVDA) handily beat street expectations on earnings (+51% growth), revenue (+61%) growth, and forward guidance.

Quarterly revenues for Q4 made a new record at $5 billion, while the company projects Q1 2021 revenues of around $5.3 billion (which would be a 72% growth rate).
To break it down by segment: Data center revenues grew +97% on a quarterly basis, and +124% annually. While gaming revenues grew +67% and 47% on a quarterly and annual basis respectively.

After a hiccup as a result of the crypto crash of 2017-18, the company is back to its winning ways.
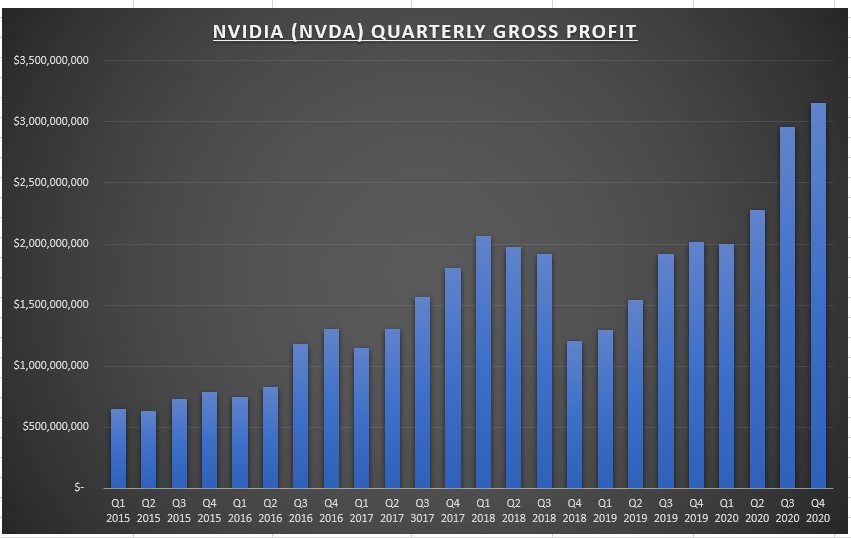
Gross margins improved sequentially from 62.6% to 63.1%, while the company projects next quarter gross margins of 63.8%.

Operating margins also improved sequentially, going from 29.6% to 30.1%, while the company projects Q1 operating margins of 31.5%.

The stock is trading down about 2% as I type this. NVDA trades about 50x forward earnings and 25x sales. The biggest near term issues deal with stuff outside the company’s control. Chip shortages remain an issue, and the company’s acquisition of ARM holdings (which would really solidify its position) has been reduced to at best a 50/50 chance of passing regulatory hurdles. I’ve also seen some analyst comments viewing the CEO’s downplaying of the crypto business as a negative. I see this is a positive. The company has learned its lesson. I’d be looking to add to NVDA if we saw a decline in the mid to low $400 level.

Salesforce (CRM) beat expectations on earnings (+65% growth in adjusted EPS) and revenues (+20% growth) while providing forward guidance that was also above expectations.

Quarterly sales continue to trend in the right direction while gross margins improved to 74.5% and non GAAP operating margins improved to 17.5%.

I added to my position on Friday mornings gap lower. The company cited the total addressable market will grow to $143 billion by 2022, with compound annual growth rates for the markets served by Salesforce’s various clouds generally ranging from 11% to 23%. The stock has underperformed the last few months after its acquisition of Slack, so the momentum may keep pushing the stock lower in the near term. But from an investors timeframe, I see a lot of potential over the next 5+ years.
Chart(s) of the week
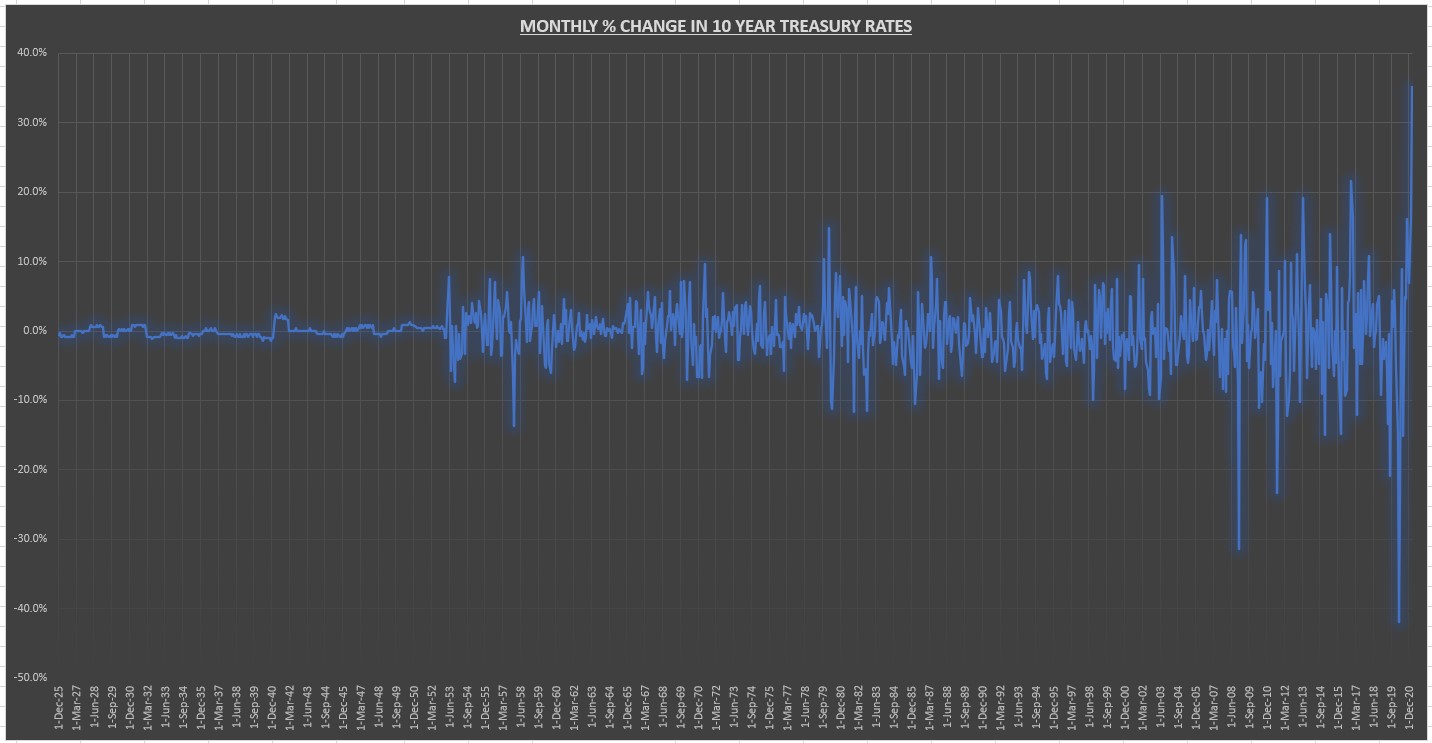
The 10 year treasury bond rate increased from 1.08% to 1.46% in February. That’s an increase of 35% in one month. I went back and looked at the data and found this was unprecedented. Yes, even when rates rose from 2% in the 1940’s to 15% in the 1980’s, the monthly acceleration was modest in comparison.
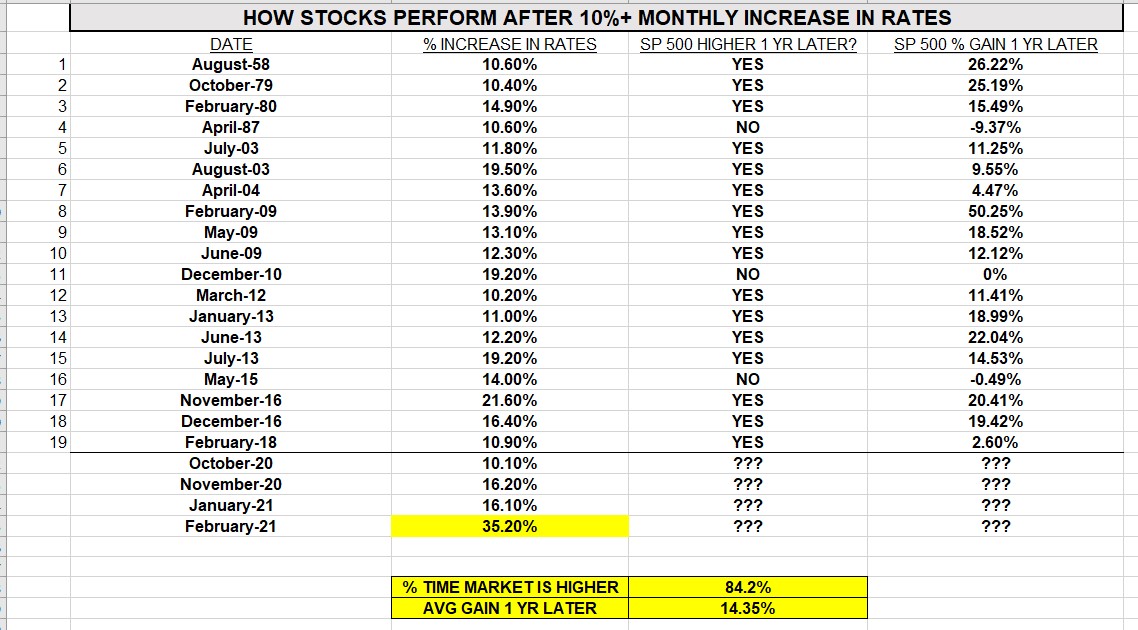
So I went back and looked at how the S&P 500 performed after a monthly increase in rates of more than 10% from 1925 to present. In 16 of the 19 occurrences (84.2% of the time) the S&P 500 was higher 12 months later. And 2 of the 3 times when the S&P 500 was lower 1 year later, it was down less than 1%. And this doesn’t include dividends, so total return would most likely be positive in 18 of the 19 occurrences.

So let’s put this recent interest rate rise in perspective. From July 1954 to September 1981 the 10 year treasury rate rose from 2.3% to 15.32%.
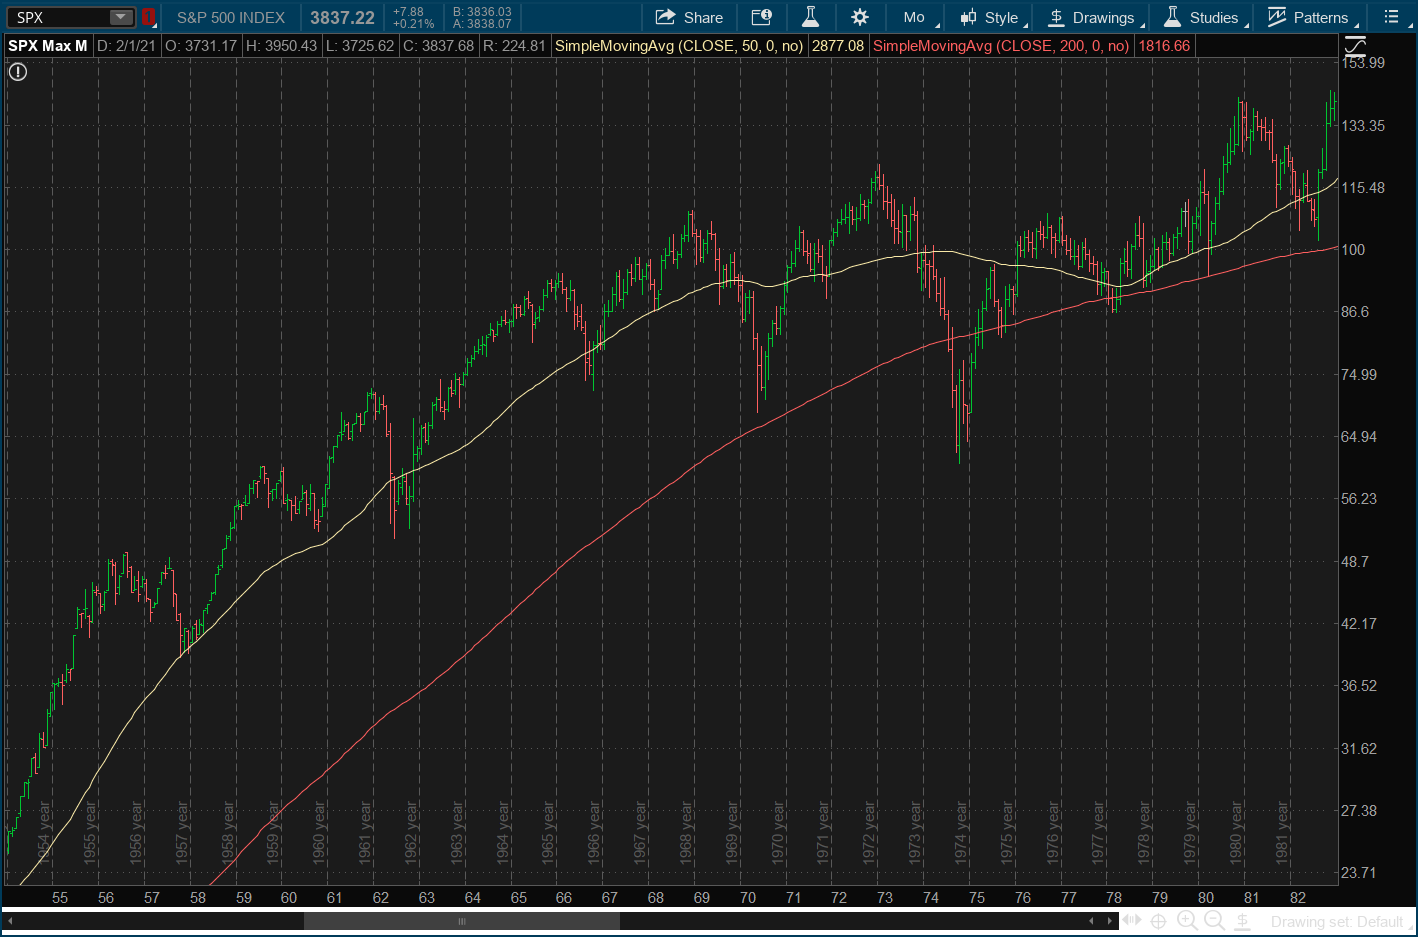
During this time the S&P 500 went from 29.59 to 116.18, an increase of 293% (not even including dividends). Now there were bear markets along the way, but rising rates doesn’t mean the stock market can’t do well.
Summary: Rates are rising for the right reasons. The economy is past recovery mode and now moving into growth mode. Real rates shouldn’t be negative in this environment. The latest CPI report showed an annual increase of 1.4% (and by all accounts it should increase in the months ahead) so a 10 year treasury rate of 1.46% pretty much brings real rates back to 0%. This is not a big deal, especially with an earnings yield of 4.5%.
Earnings look poised to grow +20% this year and I think that estimate could be on the low side if the return to normalcy remains on schedule. The economy looks poised to grow at the fastest pace in decades, and valuation is still reasonable. Don’t allow the daily market fluctuations to cause you to lose sight of this. Rising rates will affect each area of the market differently. Make sure to stay well diversified by adding some small cap, international, and quality value stocks to go with those high flying growth stocks.
Inflation may prove to be the biggest threat going forward. I’m still not convinced the Fed will be able to maintain their accommodative policy stance for years (as they seem to suggest), and this could prove to be disruptive to markets. But if I’ve learned one thing over the last decade, its to focus on what is happening, and not on what might happen at some point down the road.
Next week we have 14 S&P 500 companies reporting earnings. I’ll be paying close attention to Mercado-Libre (MELI) & Zoom (ZM) on Monday, Target (TGT) & VEEVA systems (VEEV) on Tuesday, OKTA (OKTA) on Wednesday, and Broadcom (AVGO) & Costco (COST) on Thursday. For economic data we have the ISM Manufacturing and Services report, along with the employment report on Friday.
Disclaimer: None.


