
S&P 500 Dividend Yield: Past, Present, Future
The S&P 500 is the most popular index to track the United States’ stock market.
Examining the S&P 500’s current and historical dividend yield can provide insight into the future of dividend payments in United States markets.
The dividend yield of the S&P 500 matters. In fact, dividends are responsible for around 40% of total market returns over the long run.
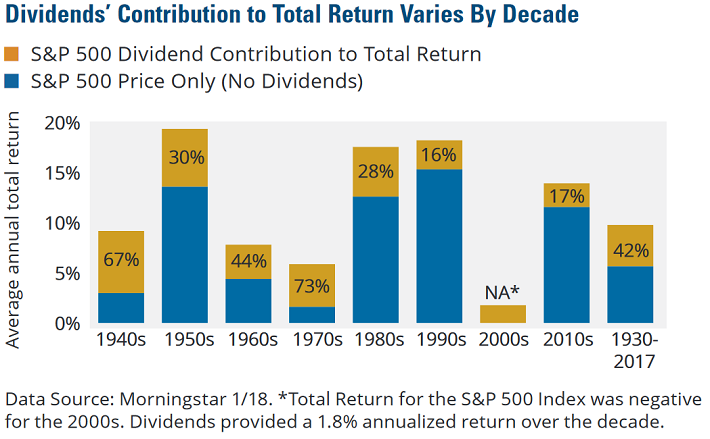
Source: The Power of Dividends, Hartford Funds, page 2
In decades with long bull markets (1990’s, 2010’s so far) dividends make up a smaller portion of total returns. When capital gains are weaker, dividends become more important.
Today, the S&P 500’s 1.8% dividend yield is near historical lows. Its historical average dividend yield is 4.3%.
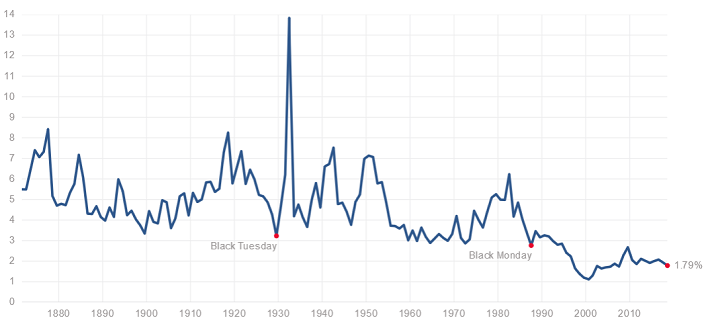
Source: Multpl.com
Part of the reason for this is because the S&P 500’s valuation level is significantly elevated. The current price-to-earnings ratio for the S&P 500 is 24.7, versus a historical average of 15.7.
If the S&P 500’s price-to-earnings ratio were to revert to its historical average, the S&P 500’s dividend yield would be 2.8% at current payout ratio levels.
But a 2.8% yield is still only 65% of the historical average yield of 4.3%. The rest of the yield discrepancy is caused by the constituents of the S&P 500paying out a smaller portion of their earnings as dividends.
Of the 6 largest S&P 500 stocks by market capitalization, only 2 pay any dividend at all. The 6 largest S&P 500 stocks by market cap along with their yields (or lack thereof) are listed below:
- Apple (AAPL) – 1.4% dividend yield
- Amazon (AMZN) – No dividend
- Google (GOOG) – No dividend
- Microsoft (MSFT) – 1.5% dividend yield
- Berkshire Hathaway (BRK-B) – No dividend
- Facebook (FB) – No dividend
The S&P 500 is market cap weighted. This means the largest companies by market cap make up a disproportionate weighting in the S&P 500. The 6 stocks above make up around 18% of the S&P 500 and have an average yield of just 0.5% between them.
Additionally, the 10 biggest stocks in the S&P 500 that pay a dividend have an average dividend yield of just 2.1%.
The S&P 500 was not always filled with so many low and no dividend stocks. The rising prevalence of share repurchases combined with low-interest rates (and resulting high valuations) have caused the S&P 500’s dividend yield to be so low.
If history is any guide, just because the S&P 500’s dividend yield is low now, does not always mean it will be so. We can study the past and current causes of the level of the S&P 500’s dividend yield to make reasonable estimations of its future.
Historical S&P 500 Dividend Yield by Year
As discussed previously, the general trend for the S&P 500’s dividend yield has been to slowly go lower. Looking at it decade-by-decade paints an ingesting picture:
- 1900’s: 4%
- 1910’s: 9%
- 1920’s: 4%
- 1930’s: 5%
- 1940’s: 7%
- 1950’s: 9%
- 1960’s: 2%
- 1970’s: 0%
- 1980’s: 2%
- 1990’s: 4%
- 2000’s: 8%
- 2010’s (so far): 0%
Source: Averages are calculated using year end data from Multpl.com.
From the 1900 through the 1950’s, the dividend yield of the S&P 500 by decade averaged between 4.4% and 5.9%. There are only 28 stocks in the S&P 500 today with a yield of 4.4% or higher today for comparison. You can see 10 of the highest yielding S&P 500 stocks analyzed here.
The 1960’s through the 1980’s saw lower average dividend yields, ranging from 3.2% to 4.2%. This was a significant decline versus the previous 60 years. And the decline would only continue.
The 1990’s were the first decade to usher in an average dividend yield of under 3%. And the 2000’s had a dividend yield average under 2%. We are on pace for an average yield of around 2% through the 2010’s as well.
Clearly, there has been a steep decline in the dividend yield of the S&P 500. Part of this decline can be explained by lower interest rates, but not all of it.
The S&P 500 (and all stocks) compete with other asset classes for investment dollars. You wouldn’t invest your money in a stock expected to return 8% a year (with significant risk – this is a stock after all) if you could get near riskless short-term T-Bills with an 8% yield.
Prevailing interest rates have an effect on market valuations, and in turn on dividend yields. All other things being equal, lower interest rates mean higher valuations of real assets (including stocks). Higher valuations means lower yields.
Interest rates alone certainly do not fully explain today’s low yields, however. Interest rates were also very low through much of the 1940’s and 1950’s, while dividend yields were high.
The Future of The S&P 500’s Dividend Yield
Where will the S&P 500’s yield by in the future? To answer this question, first, we need to determine the expected ‘fair’ payout ratio of the S&P 500 going forward.
The long-term trend of the S&P 500’s payout ratio is downward.
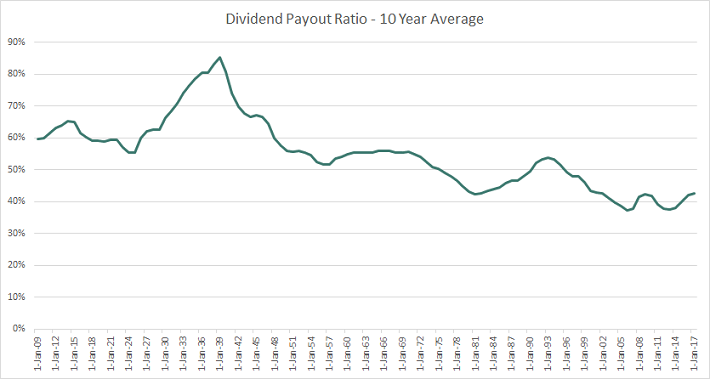
The image above calculates the payout ratio as the trailing 10-year earnings-per-share divided by trailing 10-year dividends-per-share. Taking 10 years of data smooths out 1 year periods of exceptionally low earnings (like 2009).
Large U.S. Corporations are, on average, paying out a smaller percentage of their earnings as dividends.
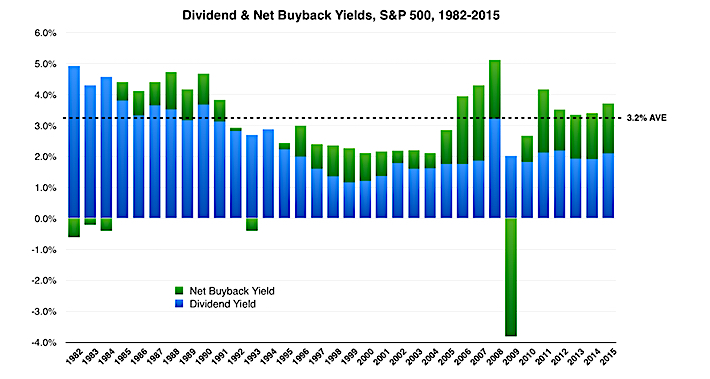
Dividend payouts are impacted by tax laws. Dividends are taxed. An alternative way to return money to shareholders is to repurchase shares. Share repurchases are not taxed. Therefore, they are a more efficient way to ‘return’ money to shareholders.
Additionally, share repurchases tend to boost share prices. When the share count is reduced while earnings remain the same, earnings-per-share increase. This, in turn, leads to a rising share price. If a company’s management team has incentive bonuses based in part on the share price, share repurchases look much more attractive to a company’s management versus dividends.
Share repurchases have accelerated in popularity since the 1980’s. This roughly corresponds with the steep decline in the S&P 500’s dividend yield since that time.
Source: Bogleheads
Factoring in share repurchases, we do not expect the S&P 500’s dividend yield to ever reach long-term averages of those seen prior to the 1960’s.
If the S&P 500 were to revert to its historical average price-to-earnings ratio, the current S&P 500 dividend yield would be 2.8%. An average yield in the range of 2.5% to 3.0% if interest rates rise and valuation multiples fall is a reasonable target for the S&P 500’s dividend yield over the long run.
Disclaimer: Sure Dividend is published as an information service. It includes opinions as to buying, selling and holding various stocks and other securities. However, the publishers of Sure ...
more


Thanks for sharing