
S&P 500 Continues Retracing Monday's Sell-Off, Upward Reversal?
The U.S. stock market indexes gained 0.5-1.1% on Wednesday, retracing some more of their Monday's decline, as investors' sentiment slightly improved. The S&P 500 index fell the lowest since late March, and it got very close to the 2,800 mark (daily low at 2,801.43) on Monday. It currently trades 3.4% below its May the 1st record high of 2,954.13. The Dow Jones Industrial Average gained 0.5% and the Nasdaq Composite gained 1.1% on Wednesday.
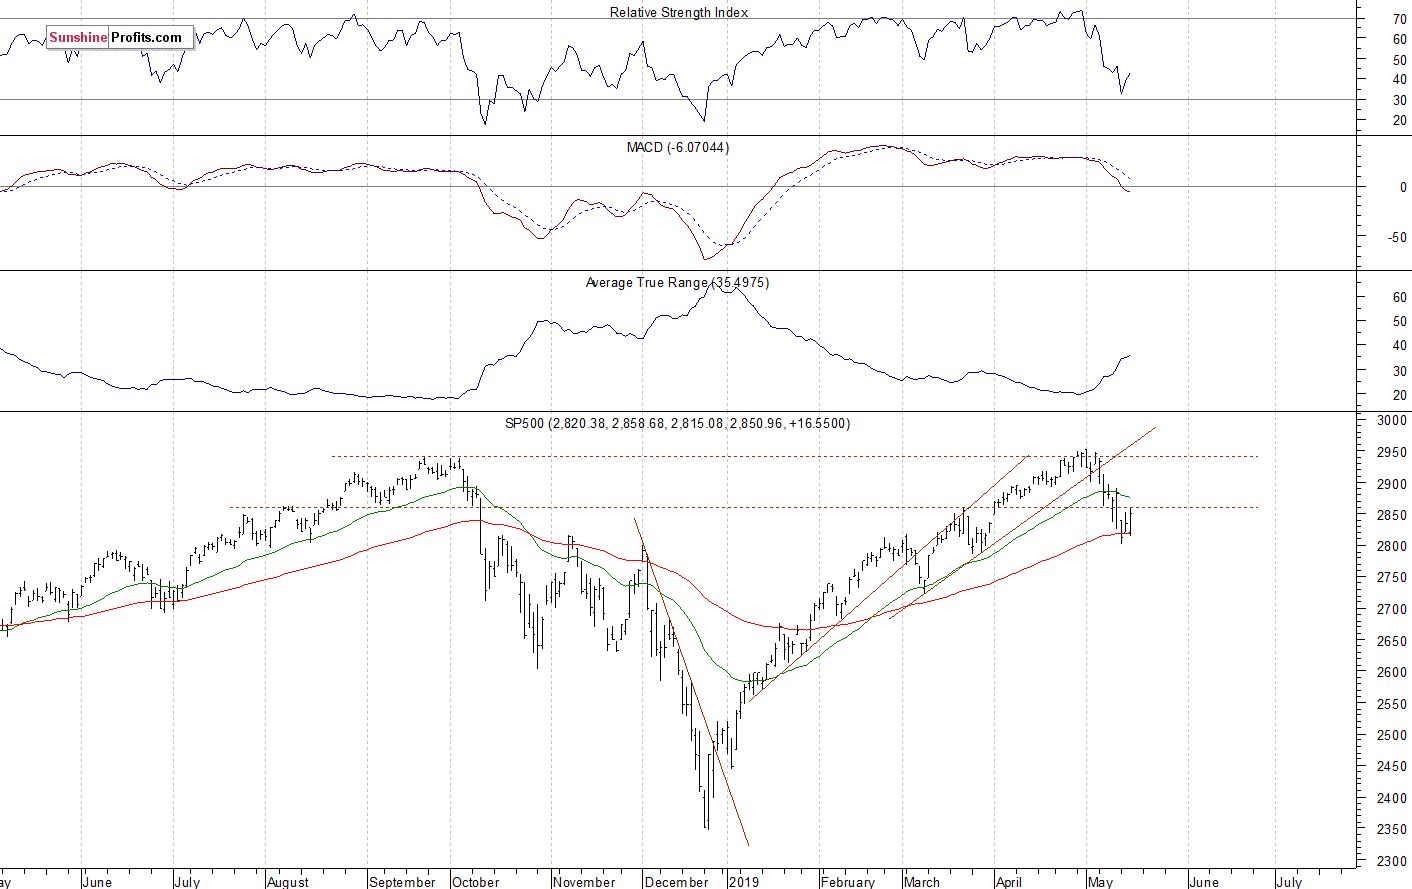
The nearest important resistance level of the S&P 500 index is at around 2,850-2,860, marked by the recent local low. The resistance level is also at 2,880-2,900. On the other hand, the support level is at 2,800-2,820. The support level is also at around 2,785, marked by some previous local lows.
The broad stock market retraced all of its December sell-off and it broke above the last year's high recently. But then the index broke below the short-term consolidation and it retraced all of the April's advance. The market also broke below its two-month-long upward trend line, as we can see on the daily chart:
More Short-Term Fluctuations
Expectations before the opening of today's trading session are positive because the index futures contracts trade 0.3-0.4% above their Wednesday's closing prices. The European stock market indexes have gained 0.3-0.8% so far. Investors will wait for some economic data announcements today: Housing Starts, Building Permits, Philly Fed Manufacturing Index, Unemployment Claims at 8:30 a.m.
The broad stock market will likely extend its short-term consolidation following Monday's sell-off. The index bounced off a 2,800 support level on Monday, and then it reached the 2,850-2,860 level on Tuesday and yesterday. So was it an upward reversal or just correction before another leg down? For now, it looks like a correction. But if the market breaks above the resistance level of around 2,890, we could see more buying pressure.
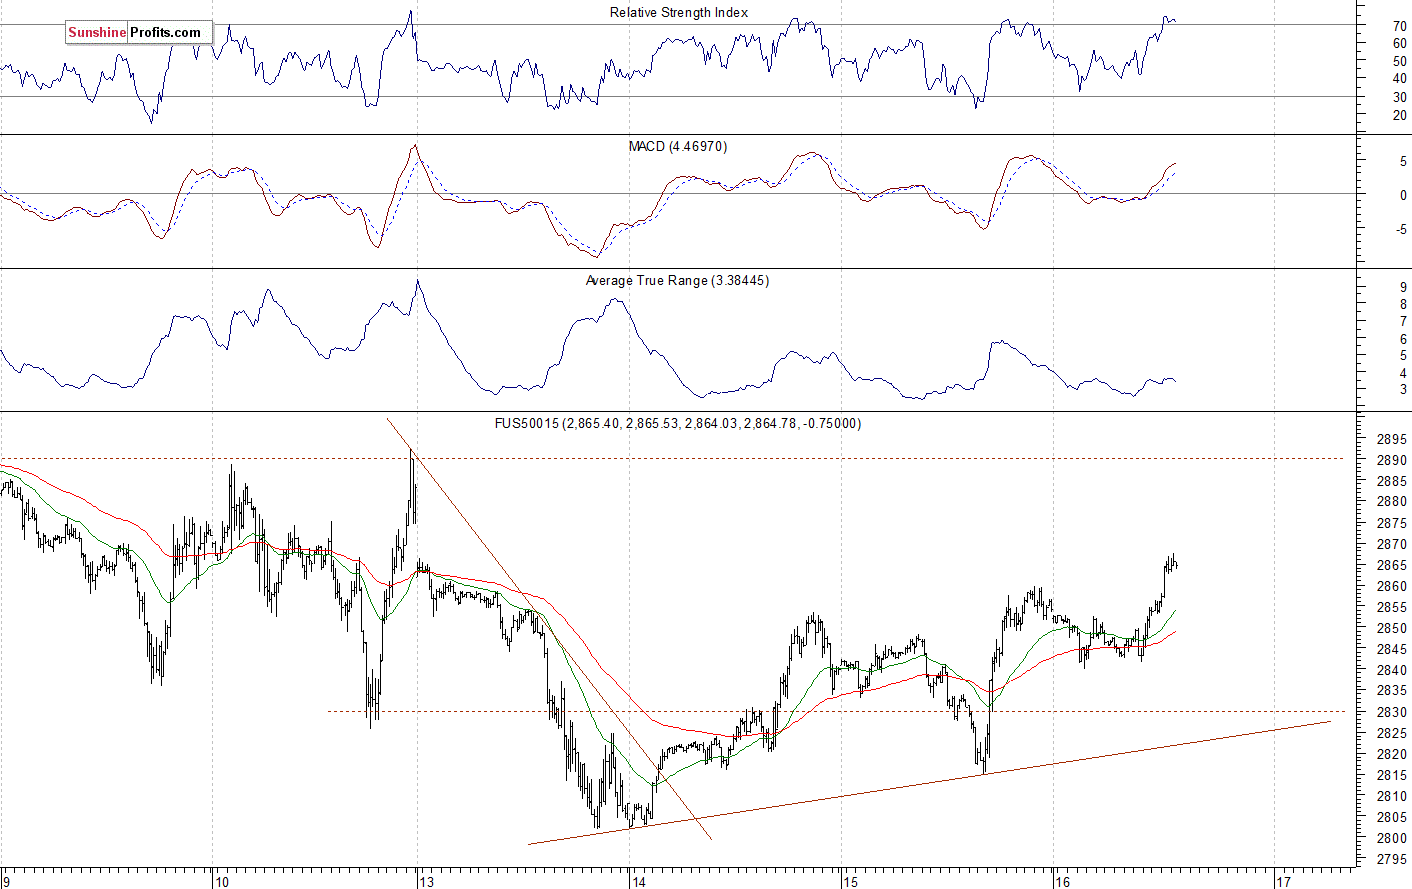
The S&P 500 futures contract trades within an intraday uptrend, as it retraces more of its Monday's decline. The nearest important level of resistance is at around 2,880-2,890. On the other hand, the support level is at 2,850, among others. The futures contract is now above its yesterday's local high, as the 15-minute chart shows:
Nasdaq Also Higher
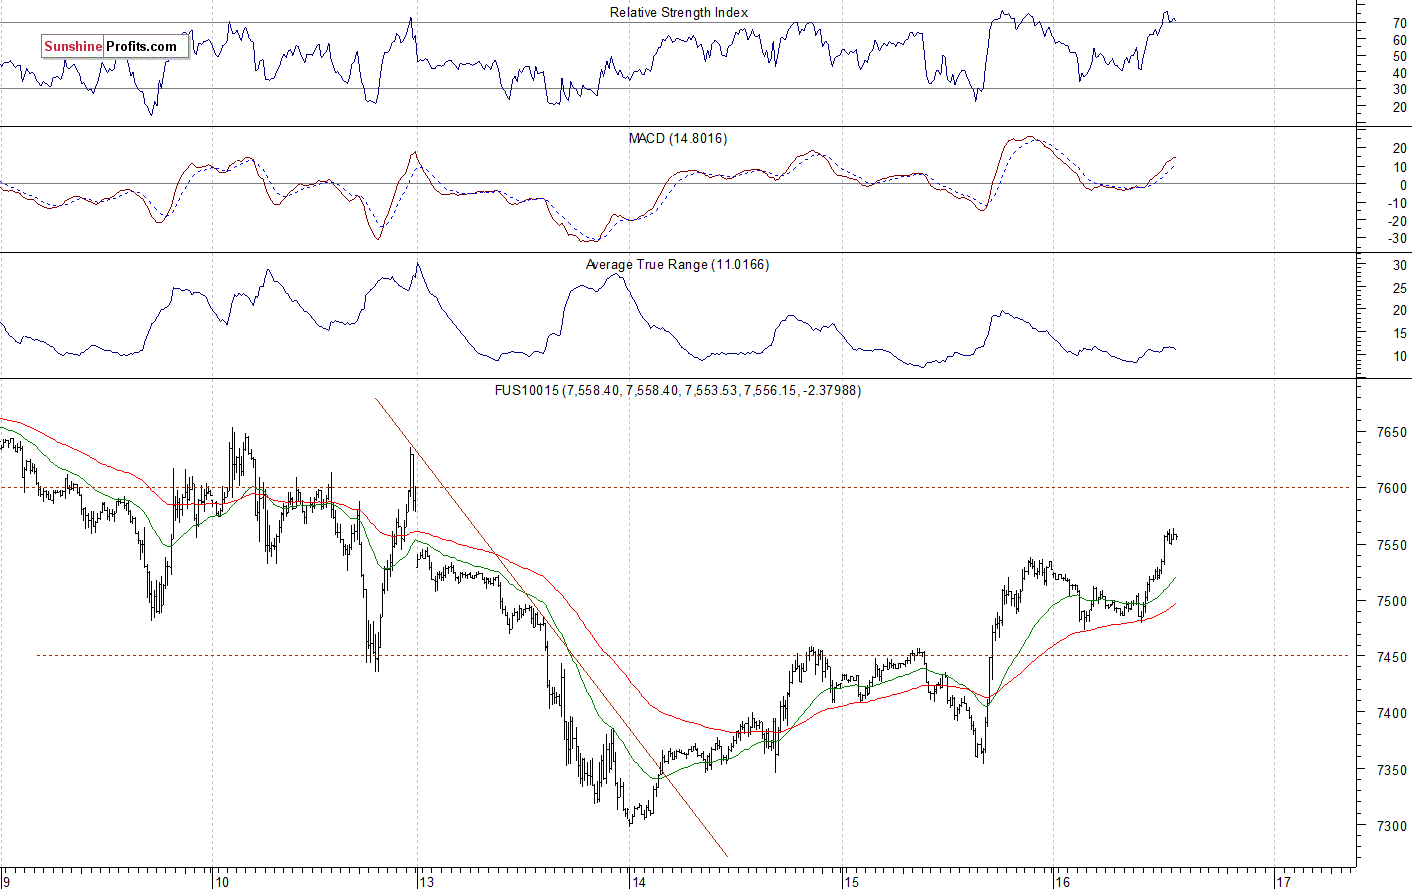
The technology Nasdaq 100 futures contract follows a similar path, as it trades at a new short-term local high. The market fell almost 600 points from its late April record high of around 7,880, before bouncing off the 7,300 mark on Monday. The resistance level is at around 7,600-7,650, marked by some previous local highs. On the other hand, the support level is at 7,450-7,500. The Nasdaq futures contract trades along the 7,550 mark this morning, as we can see on the 15-minute chart:
Big Cap Tech Stocks Rebounding
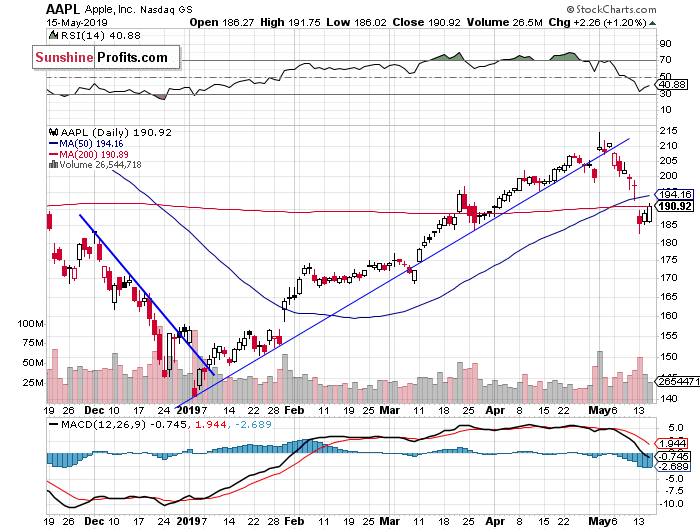
Let's take a look at the Apple, Inc. stock (AAPL) daily chart (chart courtesy of http://stockcharts.com). The stock extended its rally on May the 1st following the quarterly earnings release. Then the price reversed its upward course and broke below the medium-term upward trend line. On Monday it accelerated the downtrend as it broke below the support level of $190-195:
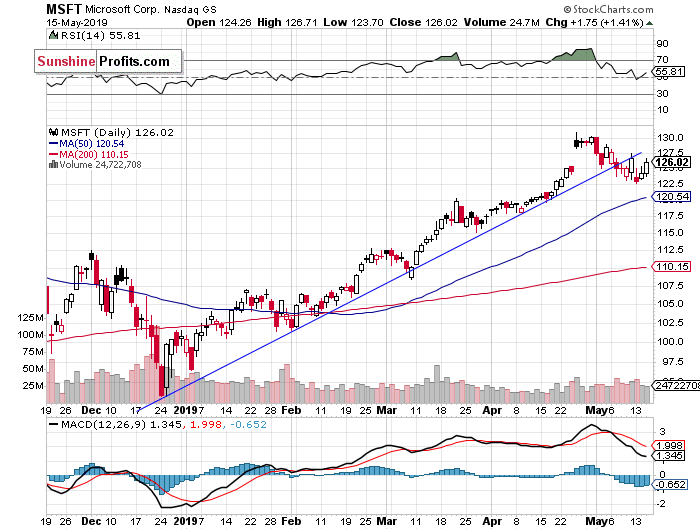
Now let's take a look at the daily chart of Microsoft Corp. (MSFT). The stock accelerated its uptrend in the late April, as it reached the new record high of $131.37. Investors reacted to a better-than-expected quarterly earnings release. But it looked like a blow-off topping pattern. And we wrote about some clear technical overbought conditions. Since then, the market is trading within a downward correction. It remains above the support level of $120-125:
Dow Jones Bouncing Off 25,000
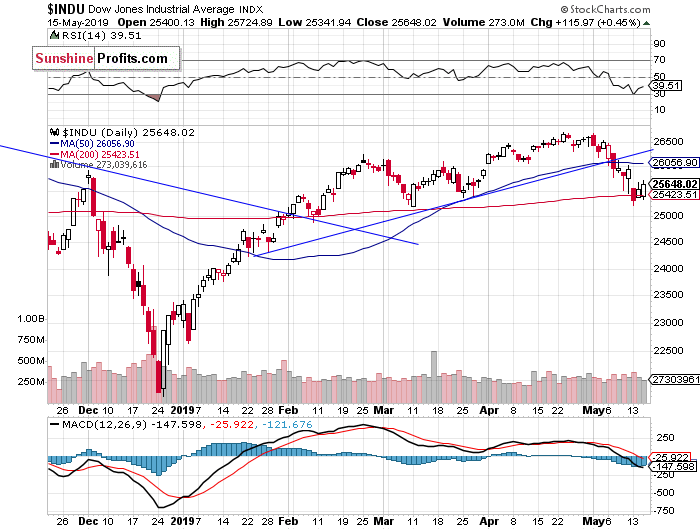
The Dow Jones Industrial Average has been relatively weaker than the broad stock market since February. The resistance level remained at around 26,800-27,000, marked by the last year's topping pattern and the record high of 26,951.8. On Monday the blue-chip stocks' gauge followed the broad stock market, as it accelerated the downtrend. The market remains close to the 25,500 mark, and at its important 200-day moving average:
Nikkei Still at 21,000 Mark
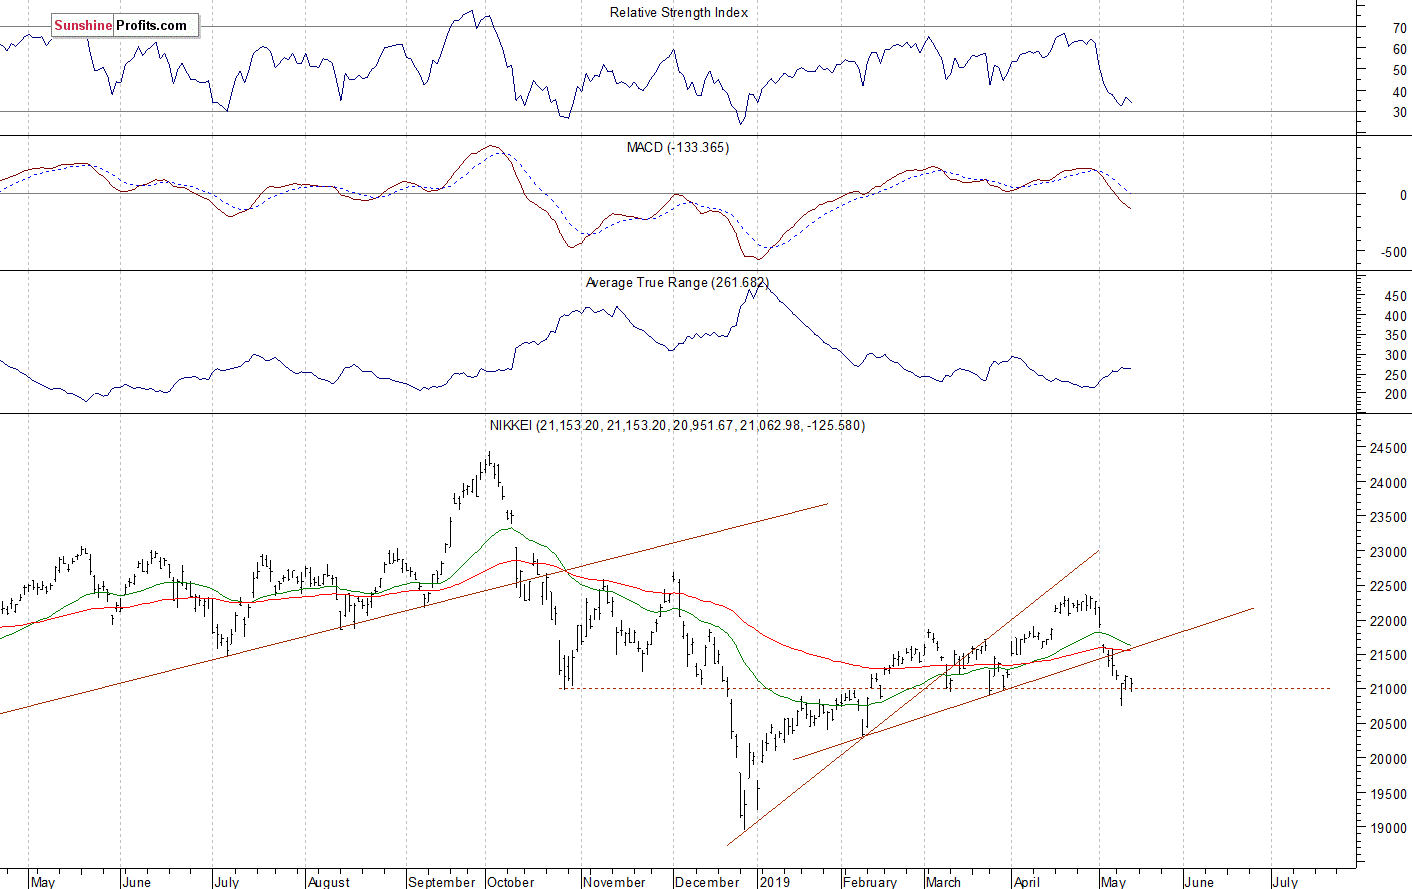
Let's take a look at the Japanese Nikkei 225 index. It accelerated the downtrend in late December, as it fell slightly below the 19,000 level. Then it was retracing the downtrend for several months. But recently the market broke below its three-month-long upward trend line. And we may see some more medium-term sideways trading action along the 21,000 mark:
The S&P 500 index has reached the new record high on May the 1st. The broad stock market extended its medium-term uptrend, as investors' sentiment remained very bullish following economic data, quarterly corporate earnings releases. But then it quickly retraced its April's advance following the renewed trade war fears. On Monday it sold off to the 2,800 mark. On Tuesday and yesterday, it bounced to 2,850-2,860.
Concluding, the S&P 500 index will likely open higher today. For now, it looks like consolidation following the recent decline. There have been no confirmed positive signals so far.
Disclosure: None.


