
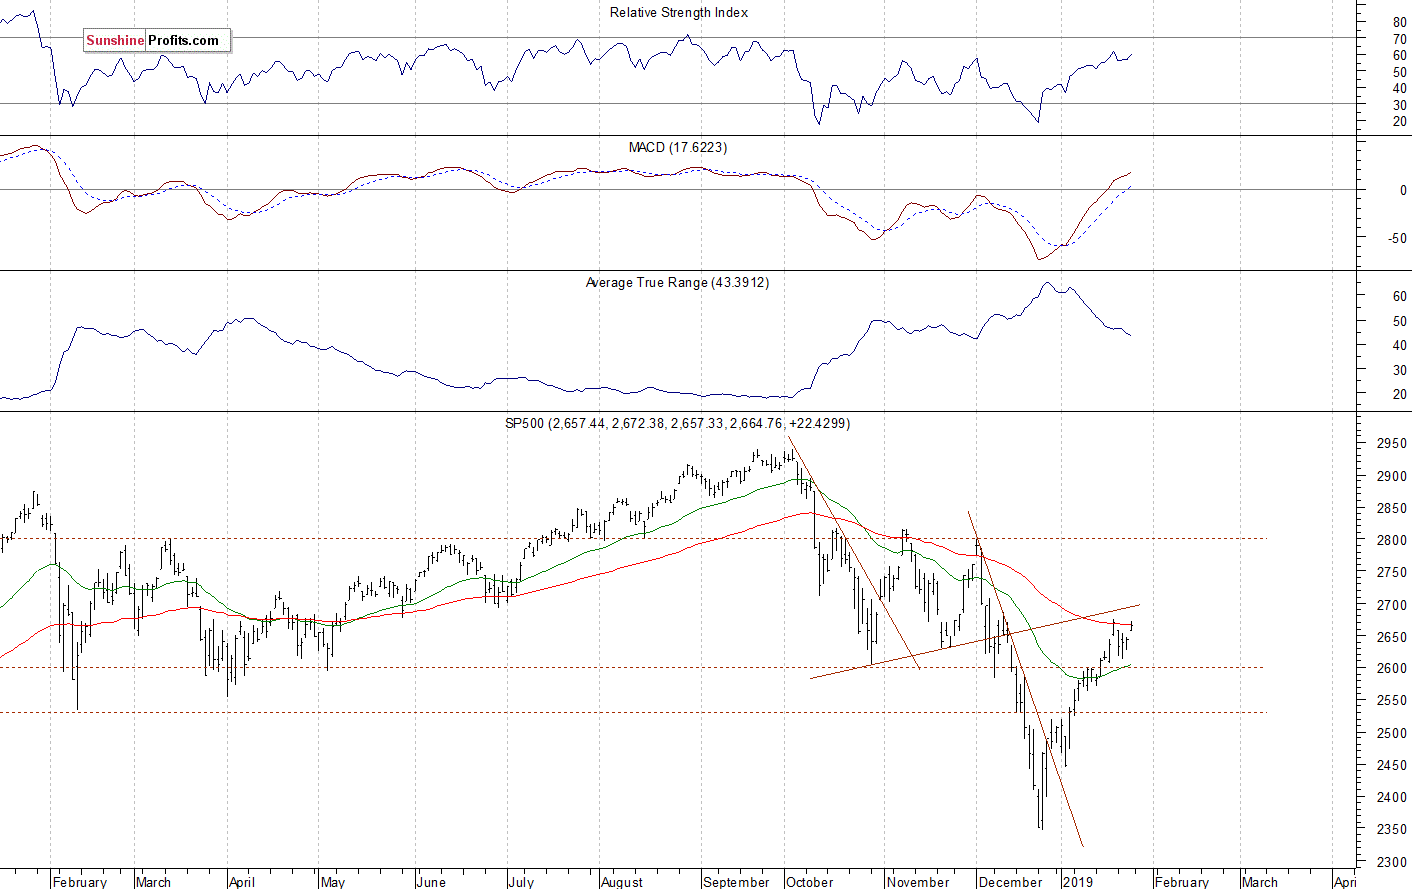
S&P 500 Back At Local High, Will Uptrend Continue?
The U.S. stock market indexes gained 0.8-1.3% on Friday, retracing their recent decline, as investors sentiment improved ahead of the quarterly corporate earnings releases, among others factors. The S&P 500 index extended its rebound off the December 26th medium-term low of 2,346.58 recently. The index traded 20.2% below the September 21st record high of 2,940.91 on that day. Then the market rallied and retraced more than 50% of the move down (at 2,643.74). It broke slightly above 2,600 and it got closer to 2,700 more than a week ago. The Dow Jones Industrial Average gained 0.8% and the Nasdaq Composite gained 1.3% on Friday.
The nearest important resistance level of the S&P 500 index remains at 2,675-2,685, marked by the early December local highs. The resistance level is also at 2,700-2,710. On the other hand, the nearest important support level is at 2,645-2,655, marked by Friday's daily gap up of 2,647.20-2,657.33. The next support level is at around 2,600-2,610. The support level is also at 2,570-2,585, marked by some recent local lows.
The broad stock market broke below its two-month-long trading range in the mid-December, as the S&P 500 index fell below the level of 2,600. Then the market accelerated lower and it broke below the 2,400 mark. The downward correction reached 20.2% from the September all-time high, surpassing last year's January-February correction of around 12%. Since then, the market has retraced more than 50% of the whole decline off the September high. The index trades close to a possible resistance level of its previously broken upward trend line, as we can see on the daily chart:
Negative Expectations
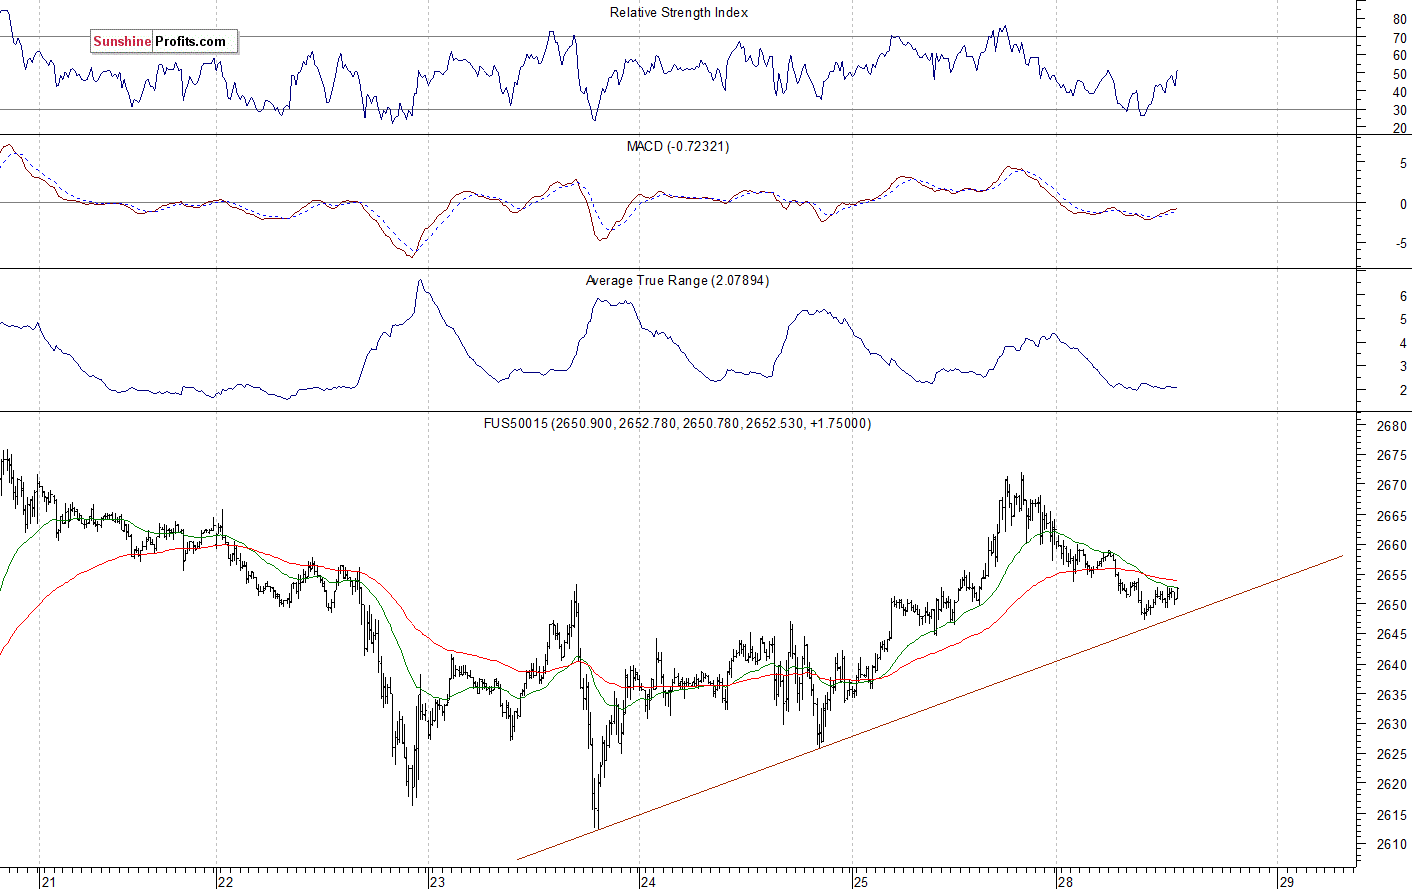
The index futures contracts trade 0.3-0.5% below their Friday's closing prices. So expectations before the opening of today's trading session are negative. The European stock market indexes have lost 0.2-0.5% so far. There will be no new important economic data announcement today. However, investors will wait for some quarterly earnings releases. The broad stock market will likely fluctuate along its recent local high. We may see another attempt at breaking higher. There have been no confirmed negative signals so far.
The S&P 500 futures contract trades within an intraday consolidation following an overnight decline. The nearest important level of resistance is at around 2,660-2,670, marked by the local high. On the other hand, the support level is at 2,640-2645, among others. The futures contract is close to the short-term upward trend line, as the 15-minute chart shows:
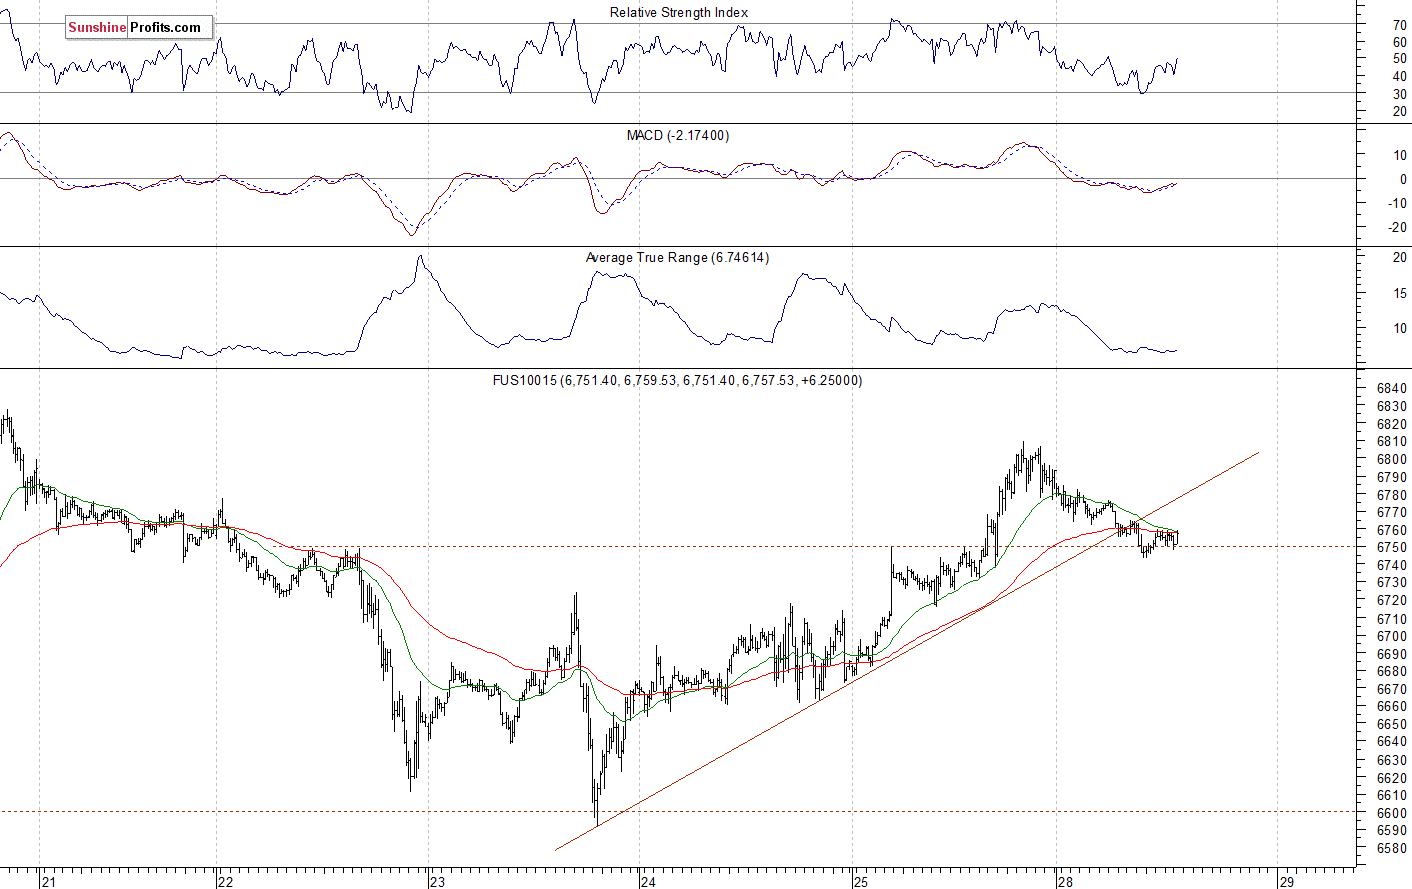
Nasdaq Also Lower This Morning
The technology Nasdaq 100 futures contract follows a similar path, as it trades within an intraday consolidation following an overnight decline. The market gained over 1,000 points from December the 26th local low of around 5,820 recently. The nearest important resistance level is now at 6,800-6,830. The support level is at 6,650-6,700, marked by some recent fluctuations. The Nasdaq futures contract trades along the previous resistance level, as we can see on the 15-minute chart:
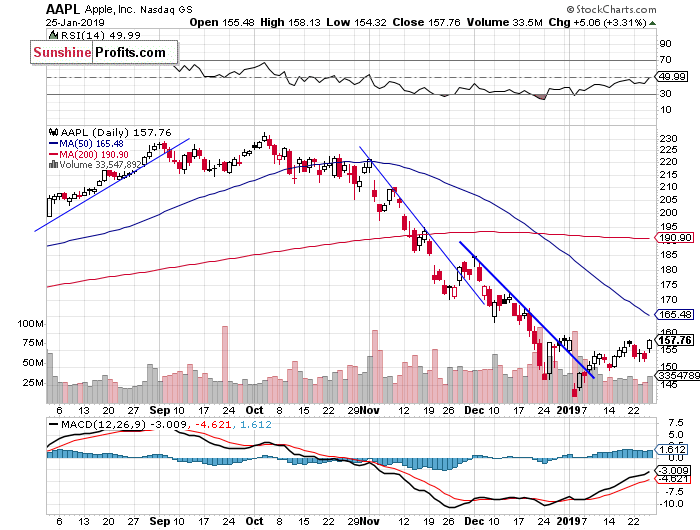
Apple Gains Ahead of Tomorrow's Earnings Release
Let's take a look at the Apple, Inc. stock (AAPL) daily chart (chart courtesy of http://stockcharts.com). The stock sold off in early January, as it reached the new medium-term low of $142. We saw clear short-term oversold conditions and then the stock retraced some of its recent decline. It broke above the month-long downward trend line, but it still trades at the resistance level of $155-160:
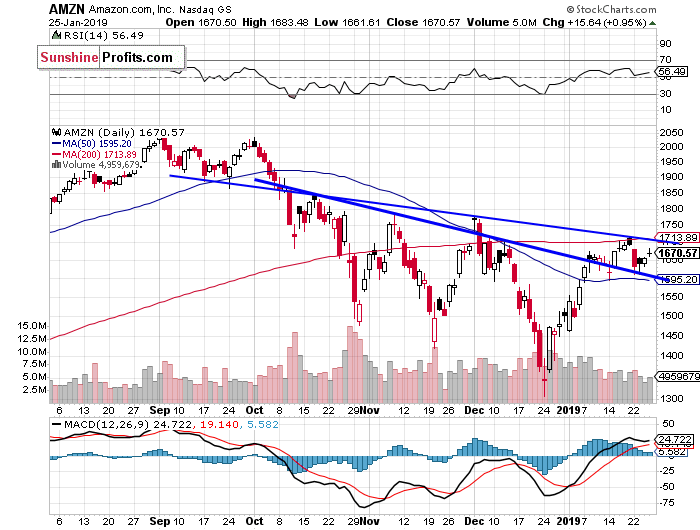
Now let's take a look at the daily chart of Amazon.com, Inc. (AMZN). The stock accelerated its downtrend in the late December and it reached a new medium-term low of $1,307. Since then it has been consequently advancing. The market broke above one of its three-month-long downward trend lines. There is a close resistance level at around $1,700-1,750:
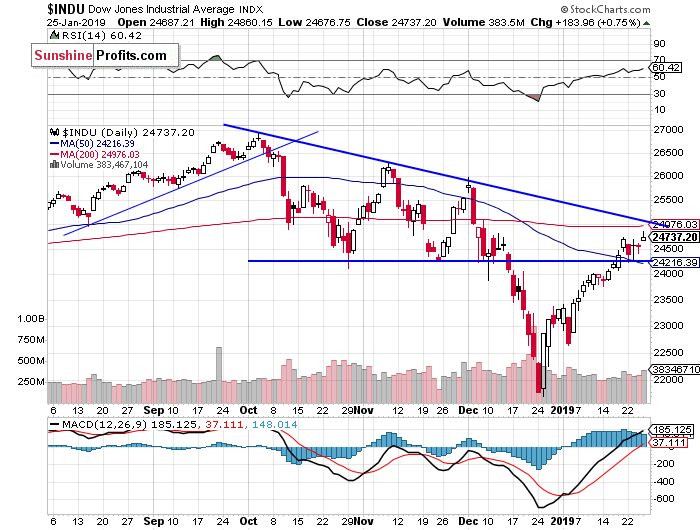
Dow Jones at New Short-Term High
The Dow Jones Industrial Average extended its short-term uptrend on Friday, as it broke above the recent trading range. The market is back above its October-December local lows. So will it continue higher and reach the record high again? There have been no confirmed negative signals so far. However, the resistance level remains at the mentioned 25,000 level:
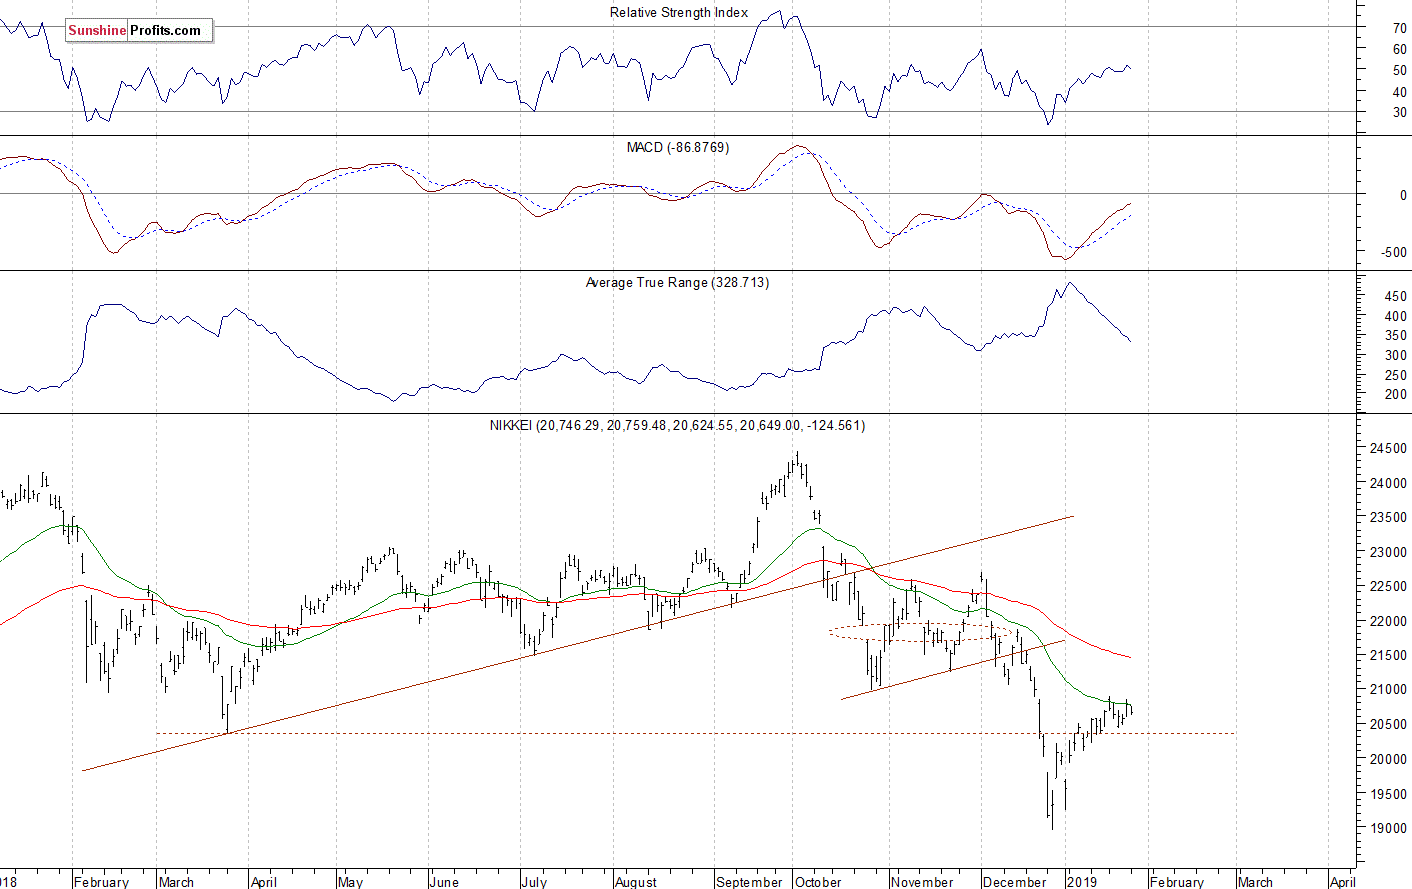
Japanese Nikkei Still Below Medium-Term Lows
Let's take a look at the Japanese Nikkei 225 index. It accelerated the downtrend in late December, as it fell slightly below the level of 19,000. Since then it has been retracing the downtrend. Recently we saw an advance above the level of 20,000. For now, it still looks like an upward correction and the Nikkei is relatively weak, as it remains way below the October - November local lows:
The S&P 500 index extended its short-term uptrend a week ago, as it broke above the mentioned 50% retracement of the whole downtrend from the record high. Is this a new medium-term uptrend? Last week we saw a short-term flat correction. And the medium-term picture remains quite bullish.
Concluding, the S&P 500 index will likely open lower today and then we may see some more short-term fluctuations. For now, it looks like a relatively flat week-long correction within an uptrend.
Disclosure: None.


