

Image Source: Unsplash
US Stocks Outlook
- The S&P 500 and Nasdaq 100 slid for the second consecutive session, though losses were limited.
- U.S. Treasury yields soared as Fed officials signal their work to slow inflation is not yet done.
- The ISM Services survey due for release Wednesday morning may be an important price action catalyst.
U.S. stocks retreated for a second straight day on Tuesday on fragile market sentiment amid rising geopolitical tensions in Asia, after U.S. House Speaker Pelosi's visit to Taiwan angered China, prompting the communist government to launch missile tests and other military exercises in the region. The sharp upswing in U.S. Treasury yields also contributed to the cautious mood, preventing risk assets from resuming their late July rally.
When it was all said and done, the S&P 500 fell 0.67 % to 4,091, with the real estate sector leading the decline on Wall Street. The Nasdaq 100, for its part, edged down 0.30% to 12,902 after failing to clear a key technical resistance near the 13,000 psychological level.
Bond yields rose sharply in the session after several Fed officials, including Mary Daly and Loretta Mester, said that the fight against inflation is far from over and that there is still work to be done to rebalance supply and demand in the economy. These statements suggest that policymakers may continue to raise rates aggressively over the medium-term, despite growing bets by speculators that the central bank will pivot in 2023 to avoid a significant downturn.
Looking ahead, the current earnings season will remain front and center, but there are also high-impact events worth watching on the U.S. economic calendar in the coming days, including the non-manufacturing ISM and the labor market report.
Focusing on the ISM data, the July services PMI, due for release on Wednesday, is seen easing to 53.5 from June's 55.3, indicating that the recovery continues to weaken. While the headline figure will give a sense of the health of the economy, traders should also pay attention to the inflation component of the survey: the prices paid index.
If this indicator begins to roll over quickly in line with recent developments in the manufacturing sector, sentiment could improve despite any slowdown in activity.
Nasdaq 100 Technical Analysis
The Nasdaq 100 has tested the 13,000-resistance area several times in recent days, but it has not been able to clear that hurdle yet. For sentiment to continue improving, the technology index must climb above that technical barrier decisively in the coming sessions.
If the breakout scenario plays out, we could see a move towards 13,240, the 38.2% Fibonacci retracement of the November 2021/June 2022 slump. On further strength, the focus shifts to 13,550. On the flip side, if sellers resurface and push prices lower, initial support appears at 12,600, followed by 12,250.
Nasdaq 100 Technical Chart
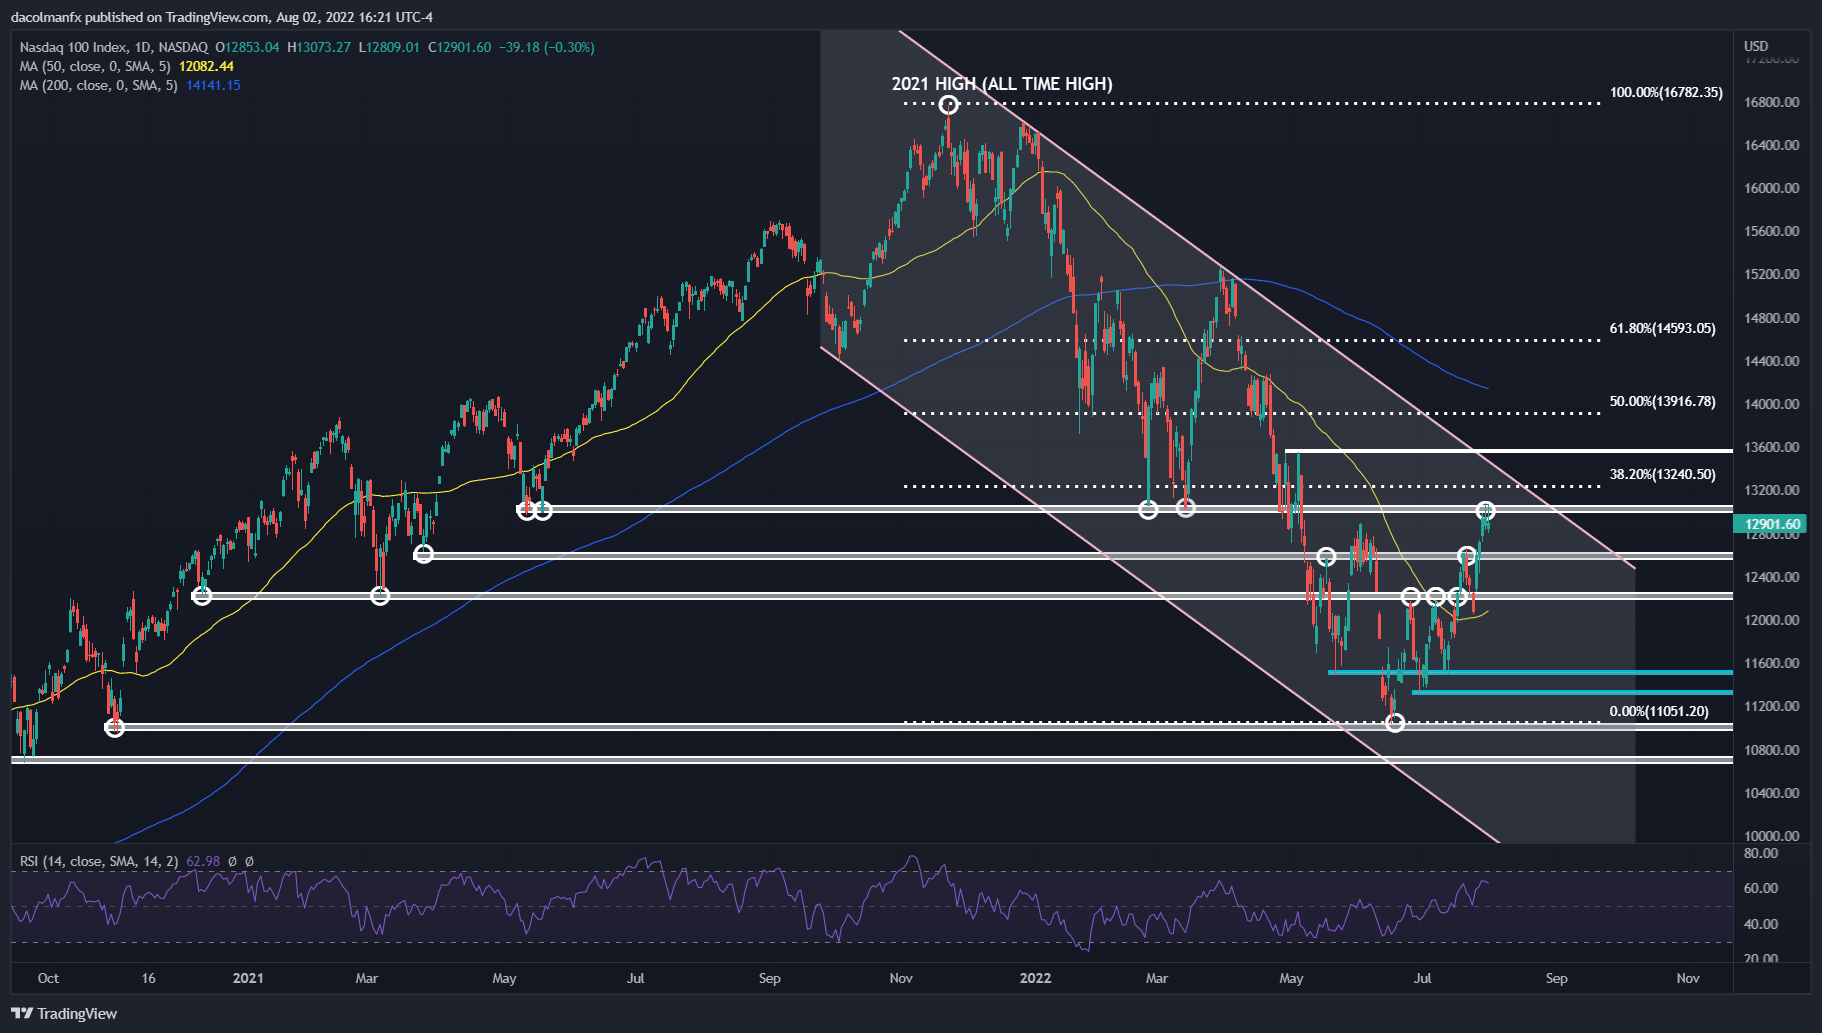
Nasdaq 100 Chart Prepared Using TradingView
More By This Author:
Gold Price Forecast: Gold Recovery Grows After Critical Support TestS&P 500, FTSE 100 Week Ahead: NFP, ISM And BoE Rate Decision
Euro Week Ahead: Non-Farm Payrolls in Focus. Will Jobs Market Offset Slowing Economy?


Comments
Log in or sign up to join the conversation.