
S&P 500 And Nasdaq 100 Equal Weights Meekly Break Out, Even As Market Cap-Weighted Cousins Itching To Do So
Equal-Weighted Indexes pertaining to both the S&P 500 and Nasdaq recently broke out, although not decisively. Their market cap-weighted cousins could soon follow them. Should that happen, it is important to consider the vigor with which that happens.
(Click on image to enlarge)
Equal-weighted indexes are an interesting beast in that they remove the market cap bias. As the name suggests, they accord small companies the same weight as they would the large ones. In their eyes, they are all equal.
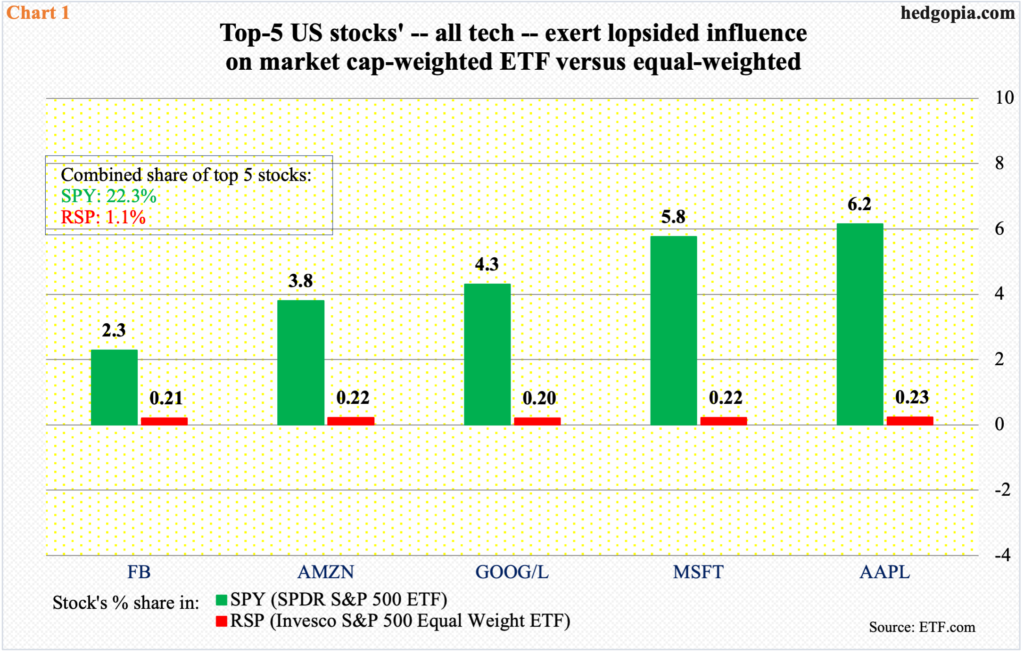
For instance, SPY (SPDR S&P 500 ETF) has the top five US companies – incidentally all tech – accounting for a combined 22.3 percent (Chart 1). This is too top-heavy. The likes of Apple (AAPL) and Microsoft (MSFT) enjoy a lopsided influence on the ETF.
In contrast, RSP (Invesco S&P 500 Equal Weight ETF) accords similar weights to all these five (Chart 1).
In normal circumstances, it is considered healthy if both equal- and market-cap-weighted indexes are moving in unison, as this suggests both the generals and the soldiers are making a move.
(Click on image to enlarge)
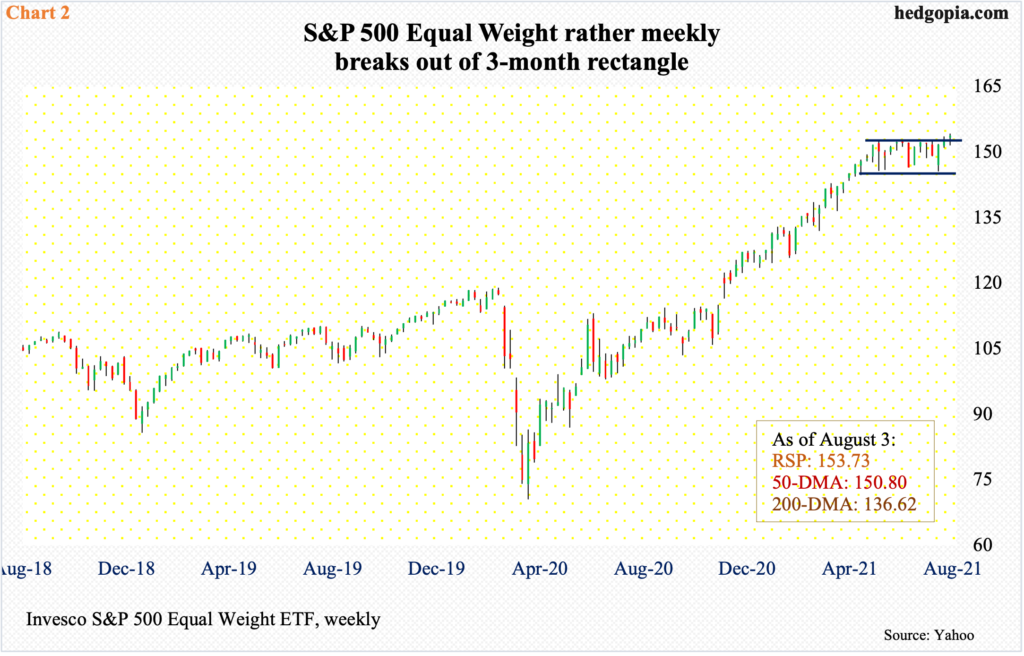
As things stand, RSP has broken out of a three-month rectangle. On Tuesday, bids showed up just under the breakout point.
With that said, the breakout is not conclusive, with the ETF (153.73) still hovering near 152.40s (Chart 2).
If it is a genuine box breakout, using a measured move target, technicians would eventually be eyeing an additional six points.
(Click on image to enlarge)
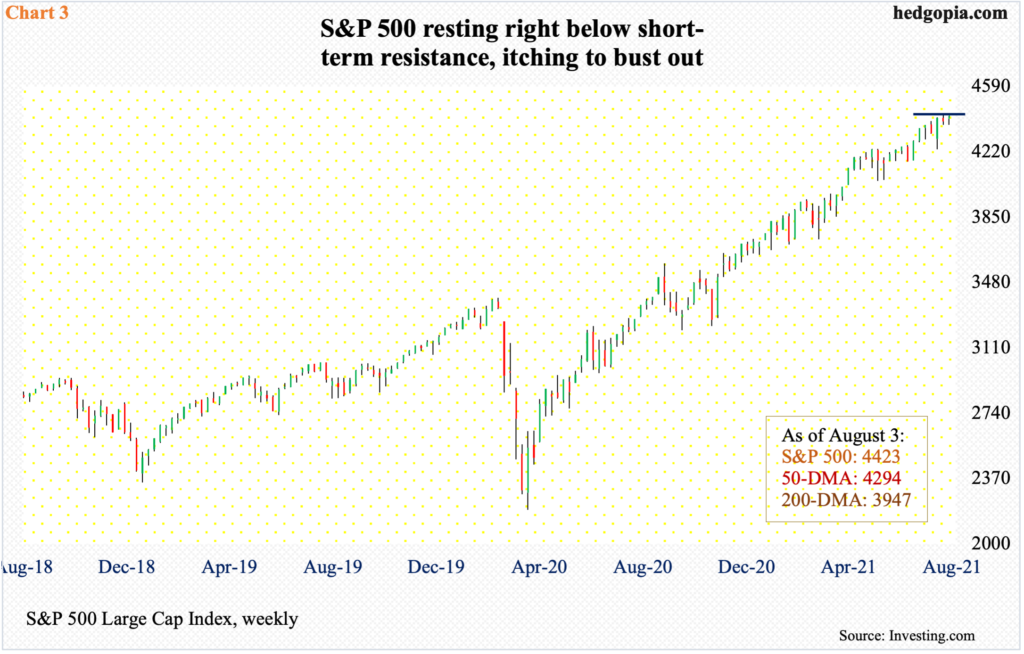
RSP’s rather timid breakout comes amidst its market-cap-weighted cousin that looks to be itching to break out itself.
On Tuesday, bulls defended short-term support at 4370s on the S&P 500. This is where the 20-day moving average lied as well; with this, the large-cap index closed right on 4320s, which bulls have been hammering on the past seven to eight sessions.
Two weeks ago, the index charted out a weekly bullish engulfing candle (Chart 3).
(Click on image to enlarge)
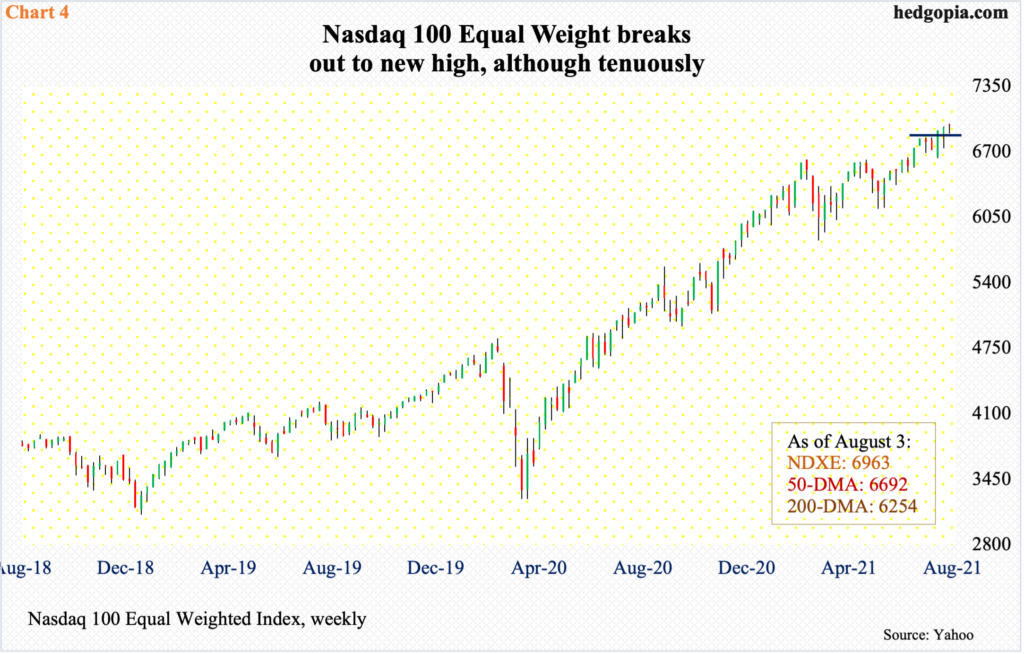
Concurrently, the Nasdaq 100 Equal Weight Index, too, broke out of 6840s three weeks ago. Tuesday’s intraday drop to 6870s was bought at the 10-day, with the index closing at 6963 (Chart 4).
As is the case with RSP, the Nasdaq 100 Equal Weight Index is hovering near its breakout point, so in effect, it could go either way. But, right here and now, bulls deserve the benefit of the doubt.
(Click on image to enlarge)
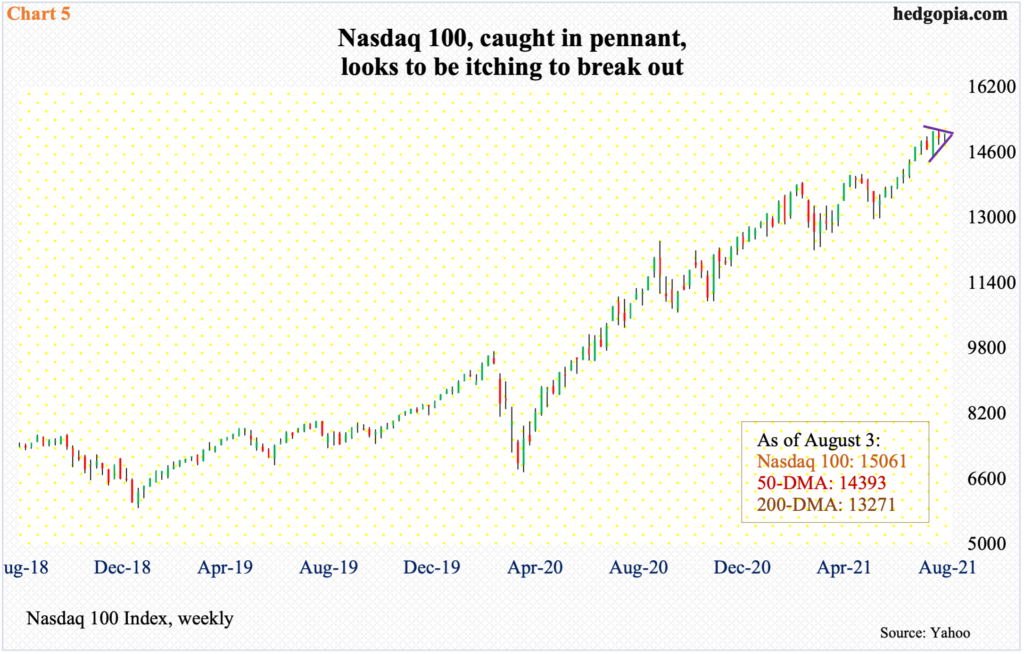
And as is the case with the S&P 500, the Nasdaq 100 looks to be itching to break out.
The index is currently caught in a pennant (Chart 5). Pennants in general are continuation patterns. If this holds up, it is just a matter of time before the index breaks out, as the preceding trend is up.
Should both the S&P 500 and Nasdaq 100 break out, how that occurs, and with what vigor, will be important. If it is a meek one – just enough to set off stop loss – then not much traction will follow. Soon, we will be entering a seasonally tough period.
Disclaimer: This article is not intended to be, nor shall it be construed as investment advice. Neither the information nor any opinion expressed here constitutes an offer to buy or sell any ...
more

