
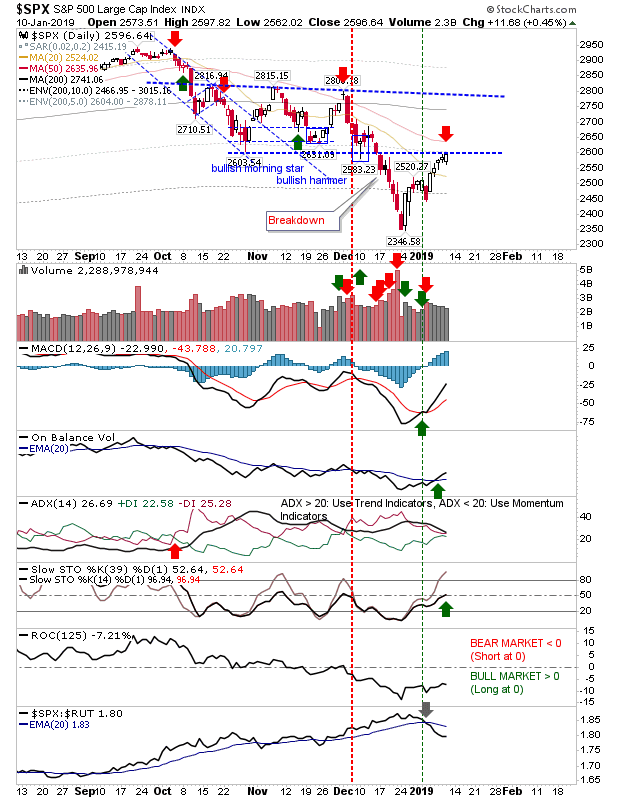
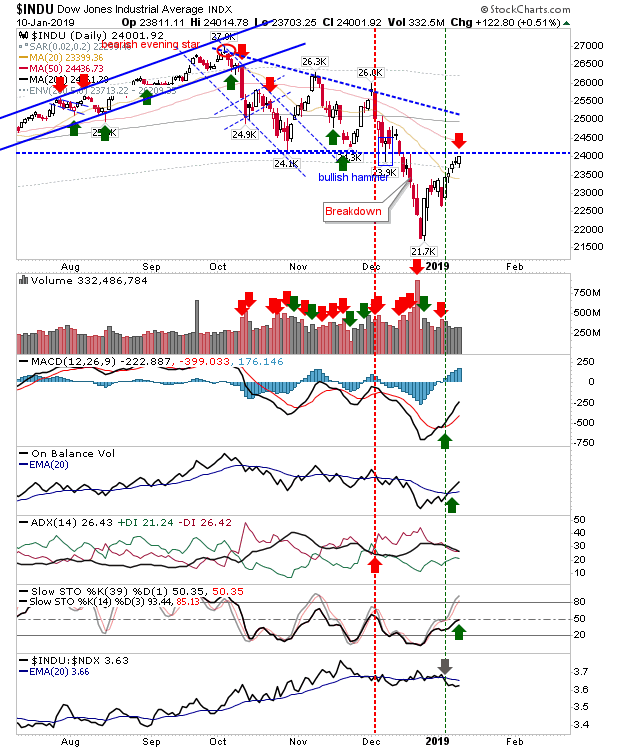
S&P & Dow Jones Reaches Resistance
Large Cap Indices finished right on resistance from the October and November swing lows; Tech indices had already tagged and breached comparable levels so the expectation is for a breach here too, but aggressive shorts can look to attack here. Stochastics [39,1] are at the 50-midline - the cut-off between a bull and bear market and both MACD and On-Balance-Volume are bullish.
(Click on image to enlarge)
(Click on image to enlarge)
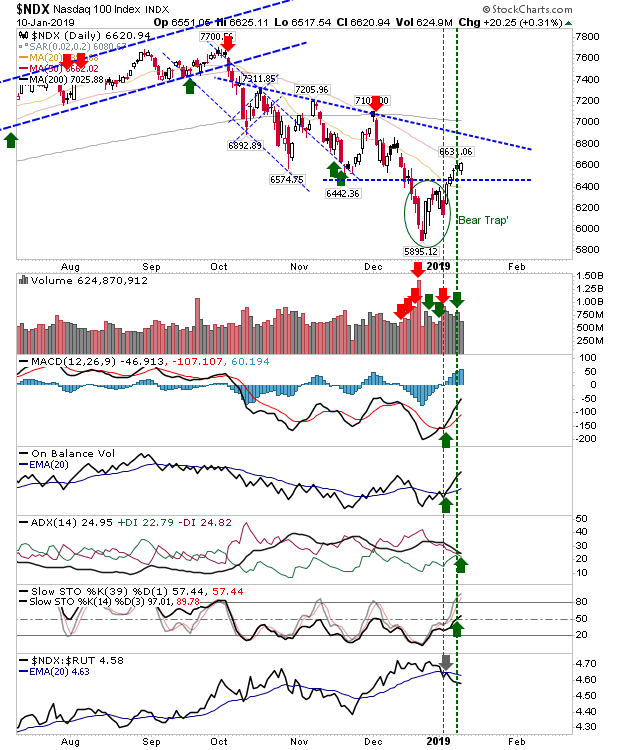
The Nasdaq 100 finished at the 50-day MA but if it can break through it will open up a rally to declining (descending triangle) resistance, although the index is underperforming relative to the Russell 2000. An undercut of November 'swing low' (6,440) would offer a new shorting opportunity to the December swing low of 5,895.
(Click on image to enlarge)
The Nasdaq has a target of 7,200 declining triangle resistance and is outperforming against the S&P (but underperforming against the Russell 2000). As with the Nasdaq 100, a cut below the November swing low (6,830) would offer a new shorting opportunity to the December swing low of 6,190.
(Click on image to enlarge)

The Russell 2000 is the only index not to have reached the swing low set from October-November or its 50-day MA. Technicals are all bullish. With the intraday range narrowing there is a possible short opportunity, but wait for an undercut of today's low at 1,425 before entering. If you operating on a buy-and-hold investor strategy you need do nothing.
(Click on image to enlarge)

For tomorrow, watch how Large Cap indices react at resistance. Should markets fade after the first half-hour it may be an opportunity to short the index and run a stop above today's highs.


