
Small-Cap Valuations: Historic Opportunity Or Overvalued?
Small-cap valuations have a unique tendency to provoke debate. During highly uncertain and declining earnings backdrops, the divisiveness over this topic ramps up.
Differences in valuation techniques and market benchmarks are amplified in small caps because of the high percentage of companies with negative earnings. Conclusions that are drawn, and resulting actions that investors take, can make or break portfolios.
Investors may be rating small caps with historically optimistic valuations that will not be justified. On the other hand, small caps often outperform in the aftermath of a recession. So, investors allocating away from them based on valuations could be missing out on significant upside.
Excluding or Including Negative Earners
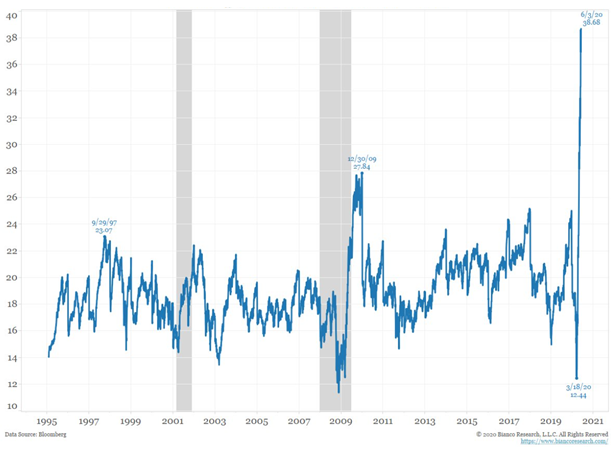
This chart was recently shared by Jim Bianco on Twitter. His conclusion: “Small cap more overvalued than anytime in history.”
Small Cap (S&P 600) Forward P/E Ratio
Bank of America Research also recently wrote that after recent gains, small caps are “near record highs.”1
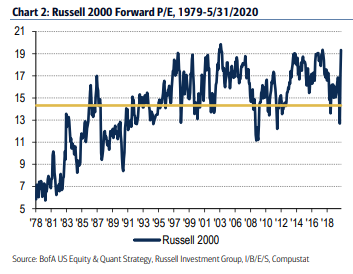
While the thrust of these observations is similar—small caps are not cheap—the first chart suggests a “run for the hills” type of bubble; the second shows valuations as rich versus history, but not significantly more so than at other points in the past few years.
The main difference between the two charts is how negative earners are treated.
The forward earnings expectations in Bianco Research’s chart include negative earners, which pushes down the earnings denominator and pushes up the P/E ratio valuation. BofA’s chart excludes negative earners.
Excluding negative earners reduces the heavy weight of technology (16%) and biotech (10%) shares in the Russell 2000.
Both approaches are widely used and accepted. But grasping the context and result of the differences is important when drawing conclusions.
Weights of Negative Earners
There are also material differences in the weight of negative earners between the two small-cap benchmarks, and how much weight is removed by looking at valuations excluding negative earners.
Eligibility for S&P’s universe has a profitability criteria that requires “the sum of the most recent four consecutive quarters’ Generally Accepted Accounting Principles (GAAP) earnings (net income excluding discontinued operations) should be positive as should the most recent quarter.”2 This profitability screen results in typically lower P/Es for the S&P 600 than the Russell 2000—19 times versus 23 times forward earnings.3
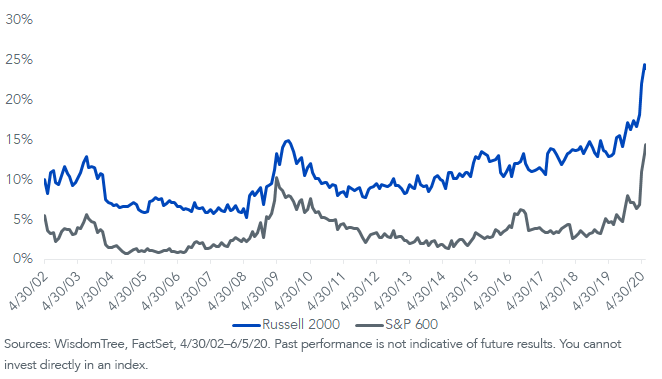
On average, the Russell 2000 has had about 10% of its weight in companies with negative earnings expectations, compared to less than 4% weight for the S&P 600. Both have seen a significant uptick in those negative earnings in recent months.
Percent Index Weight – Forward Negative Earners
Smoothed Valuations
During a recession that causes a significant uptick in the number of negative earners, valuations can spike up, especially as investors begin to price in earnings improvements before they are realized. Stock prices are a leading indicator of future earnings, with heavy emphasis on earnings more than 12 months out.
While investors may emphasize forward earnings over trailing earnings to account for future earnings drops, using forward earnings has its own weaknesses during periods of significant uncertainty—particularly when analysts are slow to guide down forecasts.
One way to adjust for the earnings drop is to use an average of historical earnings or sales in valuations.
We show seven different methods for how to assess broad market valuations of small caps. The estimated P/E ratio confirms what Jim Bianco’s chart showed—all-time-high valuations.
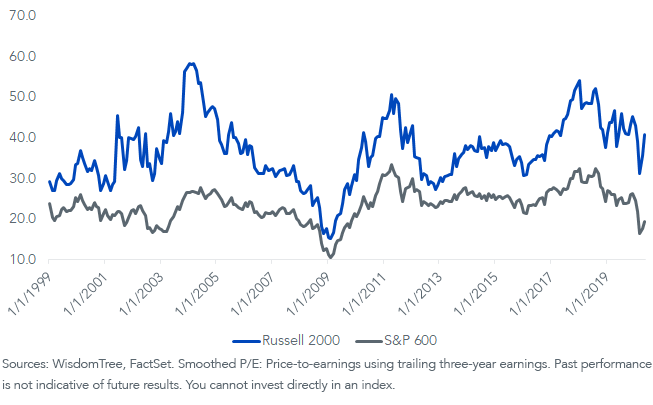
We can also use a “smoothed” P/E ratio—one that averages each constituent’s earnings over the past three years. Using this approach, we see a P/E ratio for the S&P 600 Index that is in the bottom quintile of its history. The Russell 2000 is in the 73rd percentile versus its history on the same measure.
![]()
The chart below shows the historical valuations for the Russell 2000 and the S&P 600 back to 1999 using the smoothed P/E ratio.
Smoothed P/E Ratio
Valuations vs. Large Caps
While different metrics for looking at small caps may suggest the valuation picture is not as dire as implied by forward P/E ratios, it’s fair to question if valuations properly account for the risk-return tradeoff of higher-risk small caps.
After all, small caps look to have a tougher recovery ahead than large caps that are dominated by tech and health care companies that are continuing to prosper in a socially distant world.
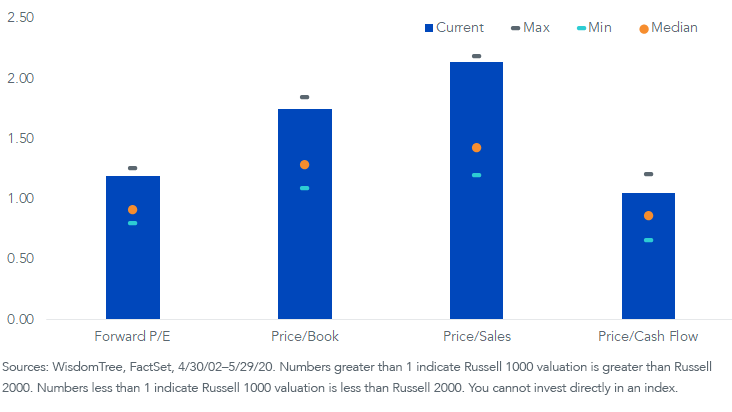
But if we look at the historical relative valuations for the Russell 1000 versus the Russell 2000 in the chart below, the Russell 1000 relative valuation is within 5% of its historical maximum on three of the four measures.
Investors may disagree on whether or not valuations of small caps are at a discount to historical measures, but perhaps there is an agreeable common ground: large caps, the main beneficiary of the Fed’s liquidity stimulus, are more richly valued than small caps.
It’s this valuation comparison that should matter to asset allocators in the long run.
Russell 1000 vs. Russell 2000 Relative Valuations
1“Small cap P/E near all-time highs as EPS expectations plummet,” BofA Global Research, 6/8/20.
2Generally accepted accounting principles (GAAP): Principles of accounting utilized in the U.S. that deal with different aspects and assumptions that are deemed acceptable in calculating the earnings of a firm.
3“S&P U.S. Indices Methodology,” S&P Dow Jones Indices, 12/17.
4Sources: WisdomTree, FactSet. Average of monthly valuations from 4/30/02–6/5/20.
Disclaimer: Investors should carefully consider the investment objectives, risks, charges and expenses of the Funds before investing. U.S. investors only: To obtain a prospectus containing this ...
more

