
Small-Business Optimism Near Record Highs, Several Sub-Indexes Diverge
Small-business optimism continues to remain near all-time highs, although several sub-indexes are diverging, including profit trend, which the Russell 2000 closely tracks.
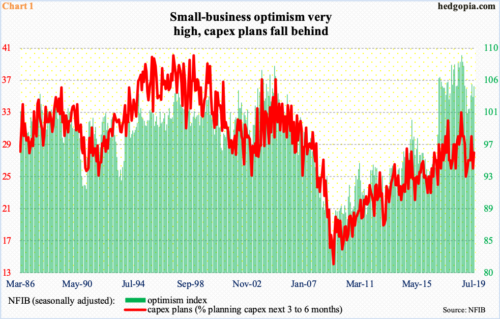
The NFIB optimism index rose 1.4 points month-over-month in July to 104.7. This was the 32nd consecutive month of 100-plus reading, including last August’s 108.8 (Chart 1). This is unheard-of in the survey’s 46-year history – quarterly since 1973 and monthly since 1986.
Small-business optimism has remained north of 100 since December 2016. In November that year, Donald Trump was elected president. That said, various other sub-indexes do not always agree with what the headline number portrays.
In July, capex plans rose a couple of points m/m to 28. The cycle high 33 was recorded last August. But unlike the optimism index, the red line is substantially below the all-time high of 40 which was hit several times in the ‘90s.
Viewed this way, small businesses remain optimistic, but they are not quite ready yet to prepare for better business conditions by investing in capital projects.
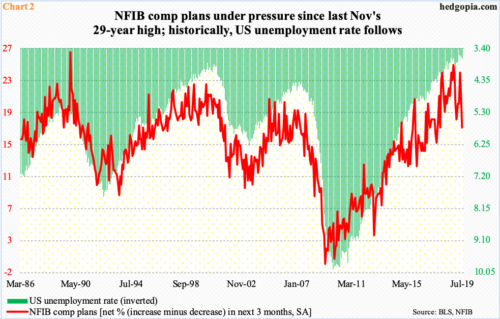
A similar message is coming from small businesses’ comp plans, which tumbled four points m/m in July to 17. Last November’s 25 was the cycle high, with the all-time high of 29 recorded in December 1989.
Historically, NFIB comp plans and the US unemployment rate move in tandem. If this relationship asserts itself, then the green bars in Chart 2 are headed higher. July’s unemployment rate was 3.71 percent, up slightly from 3.58 percent in April, which was the lowest since December 1969. In 14 out of the last 16 months, unemployment has remained sub-four. Unless small businesses change their comp plans soon, the path of least resistance for the unemployment rate is higher.
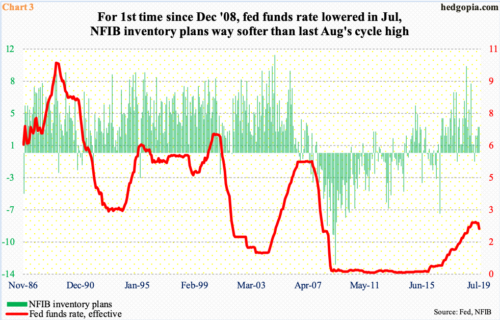
In this scenario, there is no point in accumulating inventory. In fact, NFIB inventory plans in July were unchanged at three m/m, but it is substantially below last August’s cycle high 10.
Once again, if historical relationship holds, the green bars in Chart 3 can continue lower, should the Fed continue to lower rates. Late July, the bank eased its policy rate by 25 basis points to a range of 200 to 225 basis points. This was a first cut since December 2008. Markets have priced in two more 25-basis-poiint cuts this year, one each in September and October.
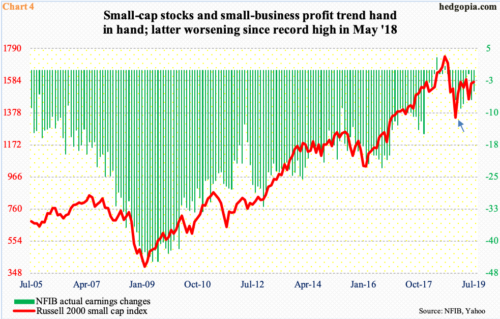
In a weakening economy, earnings will take a hit. This is no rocket science. As a matter of fact, small businesses’ profit trend is already pointing toward that direction. The ‘NFIB actual earnings changes’ sub-index peaked at three in May last year – an all-time high. In August that year, the Russell 2000 small cap index peaked at an intraday high of 1742.09. On Tuesday, it closed at 1510.58.
Unless the profit picture improves – and substantially at that – sellers should continue to show up at resistance. After the lows of December (arrow in Chart 4), the Russell 2000 rallied, until bears showed up in February at 1600, which has proven to be an important price point since January last year. As things stand, there is a long way to go before that ceiling is even tested. Around 1550 lies the underside of a broken trend line from last December. This approximates the 50-day moving average at 1542.71. The 200-day is at 1519.04. If and when these levels give way one by one, we know markets are pricing in improvement in earnings. Until then, it is bears’ ball to lose.


