
Small Business Are Extremely Optimistic
Small Businesses Ramping
Small businesses continue to do spectacularly well reinforcing the strength in the labor market and the overall economy. I wouldn’t necessarily claim this index is a leading indicator, but those who claimed strong small business confidence was a signal the economy was near the end of the cycle have been wrong since December 2016. The reason they have been wrong is because looking at the chart where you already know the future, it’s easy to see there is strength before the weakness a recession brings. However, there’s nothing about optimism from small business that catalyzes such weakness.
Strength can last for a few years especially since the people coming off the employment sidelines are lengthening the labor market cycle. Other positives are that the Fed still has low rates, regulations are being eliminated, and taxes have been lowered. There’s nothing about the economy being good that means it needs to crater as inflation is still benign. The CPI report comes out on Thursday, giving us an update on how worried we should be about inflation. It’s important to realize that the housing crash catalyzed the recession in 2008. It didn’t need to happen just because small business optimism was high. The housing market created phony optimism, which means it’s up to investors to determine how solid the underlying economy is. It’s up to you to determine if this optimism is based on sustainable trends. 1.5 years of heightened optimism is already longer than the bears in late 2016 thought would occur.
The June small business report was a continuation of the 19-month trend of extreme optimism which shows no sign of stopping. The headline reading was 107.2 which fell 0.6 from last month and was 0.9 above estimates. This reading was the 6th highest in the history of the NFIB survey which has existed for 45 years. There are 540 months in 45 years which means this survey is in the 99th percentile. The May survey was the 2ndstrongest in the history of the survey.
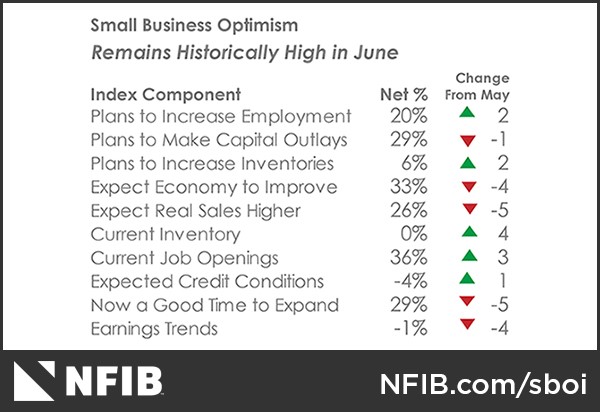
As you can see from the table below, the plans to increase employment went up 2% and the current job openings index was up 3%. I’ll review this point in more detail when I look at the JOLTS report from May. The biggest negatives were the 4% drop in those expecting the economy to improve, the 5% drop in those saying now is a good time to expand, the 4% drop in earnings trends, and the 5% drop in those expecting real sales to increase. These are all small negatives because they are coming off a great May report. I’ll need to see much more weakness before I worry about rate of change issues which signal the end of the expansion.
(Click on image to enlarge)
Great JOLTS Report
The April job openings were revised higher from 6.698 million to 6.84 million. The job openings in May were strong, but missed estimates and fell from last month as they came in at 6.638 million. Year over year openings growth was 16.7% as job creation growth outstripped hiring growth. Hiring was 5.754 million which was 4.9% growth. The openings are above the total people looking for a job which was 6.564 million in June. That was a big increase which pushed up the labor force participation rate by 0.2%. The openings surpassed those looking for a job in April for the first time in 20 years of data.
Because this is one of the best labor markets in history, workers are coming off the sidelines to take those new job openings. They were pushed onto the sidelines by the worst recession since the Great Depression. Those new workers continue to extend this labor market cycle. I think it has 3 more years of room to expand if most of the workers come back. Adding to these great stats which show the labor market is strong is the quits rate, which was up one-tenth to 2.4%. This means workers are quitting their current job because they know they can find a better one with more pay.
Job switchers see more wage growth, so the more people switching, the better the overall wage growth will be. The chart below shows the private sector quit rate. As you can see, it increased to 2.7% which is one-tenth higher than the peak last cycle. To be clear, a high quit rate is just like high small business confidence in that it doesn’t imply the cycle is nearly over. It’s obviously not in its early innings, but there’s no need for alarm yet. It plateaued for about 2 years prior to the last recession.
(Click on image to enlarge)

PPI Beats Estimates
The June PPI report signaled inflation increased, which likely means the CPI and PCE reports will beat estimates. The month over month headline change was 0.3% which was 0.2% less than last month but beat the consensus by 0.1%. The year over year change was 3.4% which was better than last month’s growth of 3.1%. As with the other inflation reports, the current year over year comparison is easy as you can see in the chart below. The year over year inflation was 1.9% in June 2017. In August 2017, the inflation was 2.4% which will make it tough for the year over year growth to continue moving up.
PPI excluding food and energy was up 0.3% month over month which met the consensus and 2.8% year over year which was above last month’s growth rate of 2.4%. Without food, energy, and trade services, it was up 0.3% month over month and 2.7% year over year.
(Click on image to enlarge)

Let’s look at the specifics of the report. Trade services saw an increase of 0.7%. Steel mill prices were up 1.9% which is a deceleration in price growth since it was up 4.3% last month. The same thing happened to aluminum which is the other primary metal affected by the Trump tariffs. Aluminum was up 2.1% after it increased 5% last month. The two month stacked growth is very high, but it’s encouraging to see deceleration as demand initially increased after the tariffs were enacted and then died down a bit. Energy was up 0.8%, gas was up 0.5%, and home heating oil was up 8%. Food was down 1.1% as vegetable prices fell 13.8%. Finally, car prices were up 0.4% and light truck prices were up 0.6%.
Disclaimer: Neither TheoTrade or any of its officers, directors, employees, other personnel, representatives, agents or independent contractors is, in such capacities, a licensed financial ...
more

