
Skewing Of Initial Unemployment Claims Ends This Week- Here's What To Look For
Courtesy of Lee Adler of the Wall Street Examiner
First time unemployment claims rose sharply as of October 5, as the effects of the chaos in Washington began to ripple through the economy. However, as I pointed out last week, the recent strength reflected in the claims data “should change radically in the weeks ahead. In the short run the data will weaken, but more important will be what happens after the government reaches a deal on the budget and the debt ceiling.”
Meanwhile, the media had some lame excuse about California’s reporting software being effed up as part of the reason for the big jump. That doesn’t wash. Two weeks ago the reports were that the glitches in the new software had been ironed out. If earlier claims hadn’t been reported, why were there no significant upward revisions applied to past weeks either in the current or prior reports. No, this jump in claims is real, and it is fallout from the gummit shutdown. I would expect most of this weakness, to be reversed once this mess is settled. The big question is how much.
The Labor Department reported that in the week ending October 12, the advance figure for seasonally adjusted initial claims was 358,000, a decrease of 15,000 from the previous week’s revised figure of 373,000. The 4-week moving average was 336,500, an increase of 11,750 from the previous week’s revised average of 324,750.
The consensus estimate of economists of 330,000 for the SA headline number was too low for the second straight week (see footnote 1) as economists had were clueless to the impact of the government shutdown. They apparently are not aware of the real-time hard data on Federal Withholding taxes, which I track weekly in the Treasury Update. They showed withholding tax collections dropping sharply over the past month. The two week jump in claims on the actual, not seasonally adjusted basis is not about a computer glitch in California. The tax data confirms that it’s real.
The headline seasonally adjusted data is the only data the media reports but the Department of Labor (DOL) also reports the actual data, not seasonally adjusted (NSA). The DOL said in the current press release, “The advance number of actual initial claims under state programs, unadjusted, totaled 357,041 in the week ending October 12, an increase of 20,902 from the previous week. There were 362,730 initial claims in the comparable week in 2012.” [Added emphasis mine] See footnote 2.
The October 5 week was the first year to year increase since early January. The number for the latest week was an improvement, but not by much. Actual filings last week represented a decrease of 1.6% versus the corresponding week last year. These numbers are much weaker than the average for the past couple of years. On an actual, not seasonally adjusted basis the trend of claims has turned flat since October 2011. However, that might not have been the case in the absence of the government shutdown. Let’s see what November, and a return to “normal” brings.
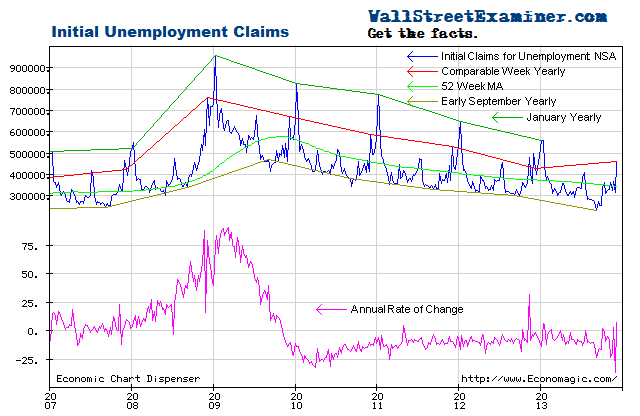
Initial Unemployment Claims – Click to enlarge
There’s usually significant volatility in this number with a usual range of zero to -20%. Prior to the October 5 week it had been consistently strong. Excluding the mid September reported “glitch” weeks, over the 2 months before that the rate of decline was -10% to -13%. The average weekly year to year improvement of the past 2 years is -8.1%. In the second and third quarters, claims as a percentage of the total employed were at levels last seen at the end of the housing bubble, just before the market and economy collapsed.

Initial Unemployment Claims Percentage of Total Employed – Click to enlarge
That all changed when the government shutdown began. Now that a political deal has been struck to kick the can down the road for 3-4 months and federal workers are going back to work, the question is if claims will return to their recent past pattern, or if this shock to the system has a lasting impact. We probably won’t know the complete answer for a month or two. If the numbers snap back sooner, that would indicate no lasting damage.
The current weekly change in the NSA initial claims number is an increase of 22,000 (rounded and adjusted for the usual undercount) from the previous week. That compares with an increase of 33,000 for the comparable week last year. The second week of October was an up week 70% of the time in the prior 10 years. The average change for the comparable week over the prior 10 years was an increase of 14,000. The numbers for this week were better than last year but somewhat worse than average. Some Federal workers were “unfurloughed” last week. The rest should be back next week, but new claims from the shutdown should stop increasing in the data for this week to be released next Thursday.
Federal withholding tax data has slumped sharply since the end of September. It was still on trend until late September when there was a sharp downtick. That continued through October 15. The government shutdown clearly had an effect on withholding taxes collected. Economists have no excuse for missing these numbers by as much as they did.
To signal a weakening economy, current weekly claims would need to be greater than the comparable week last year. That happened in the October 5 week, but I gave it a mulligan. The trend had previously been one of accelerating improvement in spite of the fact that the comparisons are now much tougher than in the early years of the 2009-13 rebound. I want to see what happens now that Federal workers are going back to work. Will this data return to trend or not? The answer to that question will tell us whether the shutdown has any long term effect on the economy.
The government shutdown polluted this data. I suggested last week that we take it with a grain of salt while everyone else was crying, rending their clothes, and gnashing their teeth, or blaming a glitch. Over the next couple of weeks we get back to the real game.
Relative to the trends indicated by unemployment claims, stocks have been extended and vulnerable since May. QE has pushed stock prices higher but has done nothing to stimulate jobs growth.
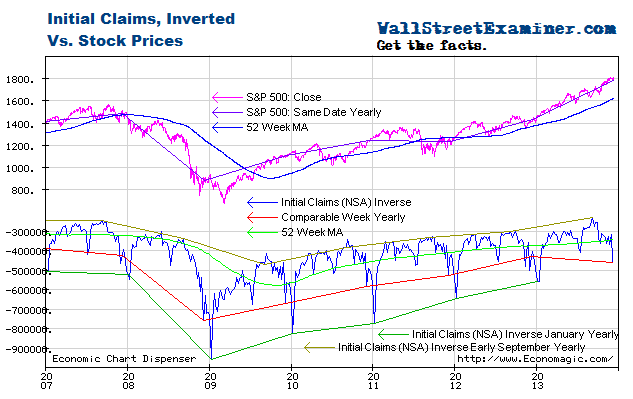
Initial Unemployment Claims and Stock Prices- Click to enlarge
I plot the claims trend on an inverse scale on this chart with stock prices on a normal scale. The acceleration of stock prices in the first half of 2013 suggested that bubble dynamics were at work in the equities market, thanks to the Fed’s money printing. Those dynamics appeared to have ended in July but the zombie has kept coming back to life. I address the specific potential outcomes in my proprietary technical work.
Get regular updates the machinations of the Fed, Treasury, Primary Dealers and foreign central banks in the US market, in the Fed Report in the Professional Edition, Money Liquidity, and Real Estate Package. Click this link to try WSE's Professional Edition risk free for 30 days!
Copyright © 2012 The Wall Street Examiner. All Rights Reserved.


