
Skeptical Sentiment In A Sideways Market: Bullish Or Bearish For Stocks?
Skeptical Sentiment – What Could It Mean?
As shown in the chart below, the S&P 500 has made very little progress over the past five months.
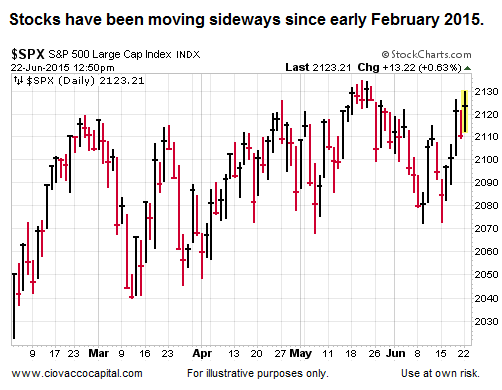
It seems logical the longer stocks “go nowhere”, the more skeptical investors become. What does history tell us about waning enthusiasm for stocks that occurs over several weeks? From Barron’s:
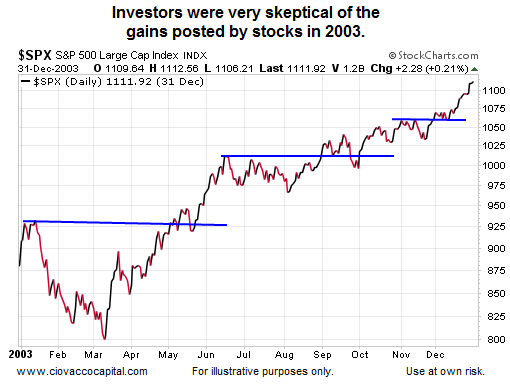
Just 25% of respondents to the latest American Association of Individual Investors sentiment survey called themselves bullish [2015]. That’s the seventh week in a row that the percentage of bulls was under the long-term average of 30%, the longest such streak since 2003. Bill Smead, portfolio manager of the Smead Value fund (ticker: SMVLX), notes that the 2002 reading came “after tech stocks got crushed in the three preceding years and the index had declined more than 40% from peak to trough.” Now, despite everything that could go wrong—including a Fed interest-rate hike and the possibility of Greece leaving the euro zone—he believes the negative sentiment is bullish for stocks.
What Happened Last Time?
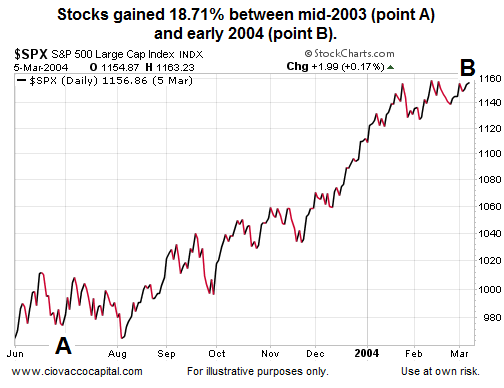
We have just had “the longest streak since 2003” of investor skepticism. Was 2003 a bad time to invest? Assume we invested on June 30, 2003 or halfway through a year marked by a long period of skepticism similar to 2015. How would we have done in stocks? The answer is shown in the chart below.
But, 2003 Was A Different Time?
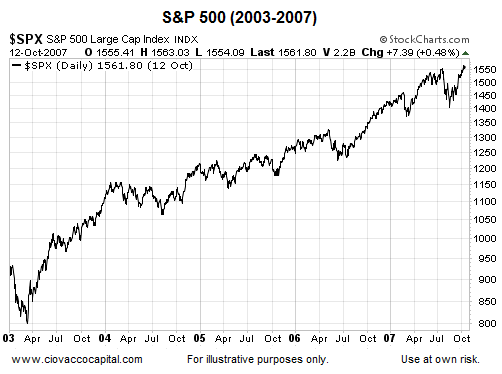
Yes, it was. The same is true for any historical reference. We did not pick 2003…history picked 2003 since it was the last time the AAII survey showed the percentage of bulls below 30% for seven consecutive weeks. In 2015, we just saw the seventh consecutive week of bulls below 30%. The chart below provides some additional insight related to the question:
Even in the face of skepticism, was 2003 a good year to invest?
Do Other Facts Support The Bullish Case?
Is sentiment a reason alone to invest? No, it is best to make decisions based on numerous inputs. Do other facts support the bullish case? You can decide after viewing this week’s stock market video, which features recent action in small caps (IWM), consumer discretionary stocks (XLY), the S&P 500, and the healthcare sector (XLV).
Video: How Vulnerable Is This Stock Market?
Other Years That Featured Tight Ranges
In addition to sentiment, we have seen stocks basically tread water in the first half of 2015. What does history tell us about similar years? From Barron’s:
In fact, stocks have performed quite well after a quiet start to the year. Paul Hickey of Bespoke Investment Group, looked at the 10 years during which the S&P 500 stayed closest to where it had started during the first 117 trading days. He found that it had risen 6.6%, on average, in the rest of those 10 years. Says Hickey: “A sideways market can be a correction in time, not price. Expect things to drift higher from here.”
How about the long-term outlook and skeptical sentiment?
As discussed in a June 12 video clip, skeptical sentiment was also present in the late 1970s and early 1980s; a period that was followed by one of the longest bull runs in stock market history.
Investment Implications – The Weight Of The Evidence
With the situation in Greece still unsettled, as always, it is important for us to keep an open mind about all outcomes (bullish and bearish). Based on the facts we have in hand, our market model is still calling for patience with our equity-based holdings. The facts and markets will guide us if we are willing to pay attention with an unbiased and open mind.
Disclosure: This post contains the current opinions of the author but not necessarily those of Ciovacco Capital Management. The opinions are subject to change ...
more

