
Silver Price Chart: XAG Rally Rips To Resistance At Fresh Yearly High
Silver prices have rallied nearly 15% from the yearly lows registered in May with last week marking the largest weekly range since July 2017 and the largest single-week advance since June of 2016. Silver is now eyeing a critical resistance zone just above the yearly opening-range highs. These are the updated targets and invalidation levels that matter on the XAG/USD weekly price chart.
SILVER PRICE CHART – XAG/USD WEEKLY
(Click on image to enlarge)
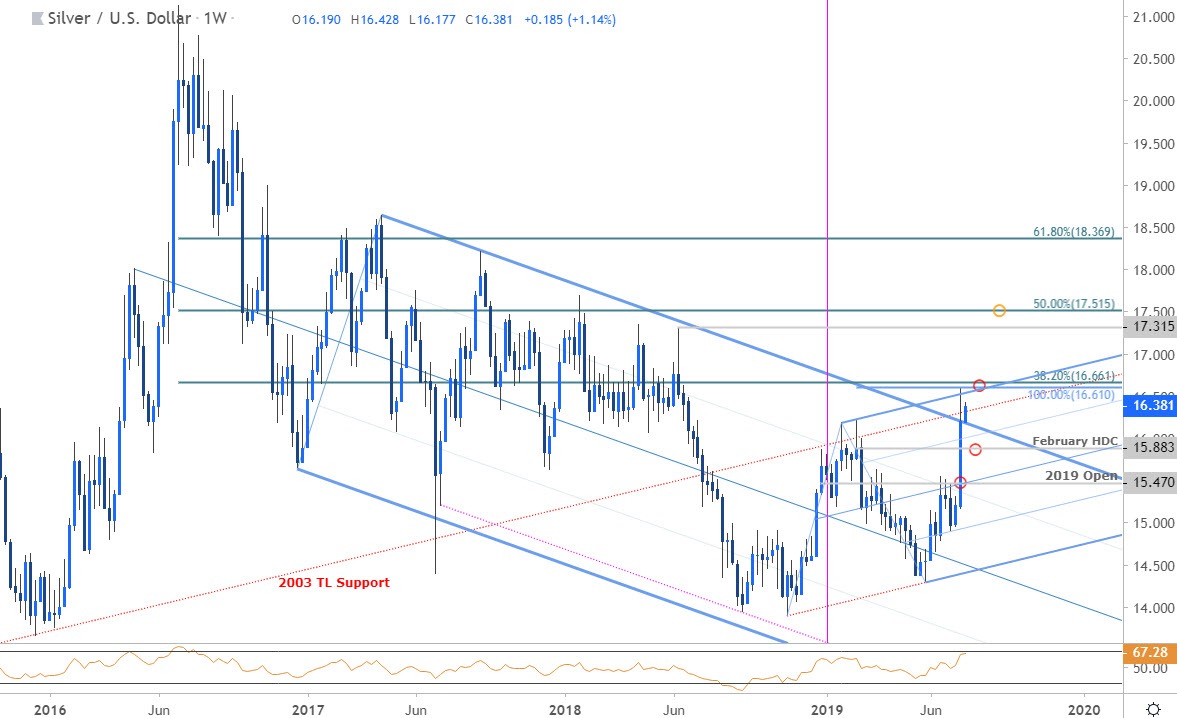
Notes: Silver prices broke above confluence resistance around the yearly open last week at 15.47 – a subsequent rally of more than 8% takes price into the first major resistance target at 16.61/66 – a region defined by the 100% of the November advance and the 38.2% retracement of the 2016 decline. Price registered a high at 16.59 last week and while the broader focus is higher, the immediate advance may be vulnerable below this level with pitchfork resistance further highlighting this threshold over the next few weeks. Note that the yearly opening-range high comes in at 16.21 – the price has yet to clear this on a close basis.
Initial support rests back at 16.21 backed by the February high-day close at 15.88- an area of interest for downside exhaustion IF reached. Broader bullish invalidation now raised to 15.47. A topside breach of this key resistance zone exposes subsequent topside objectives at the June swing highs at 17.32 backed by the 50% retracement at 17.51.
Bottom line: The silver price breakout is approaching the first major resistance hurdle at 16.61/66 – a breach/weekly close above is needed to keep the long-bias viable targeting 17 and beyond. From a trading standpoint, look to reduce long-exposure / raise protective stops on a stretch into key resistance. Ultimately, we’ll favor fading weakness while above 15.88 targeting a topside breach to fresh yearly highs.
SILVER TRADER SENTIMENT (XAG/USD)
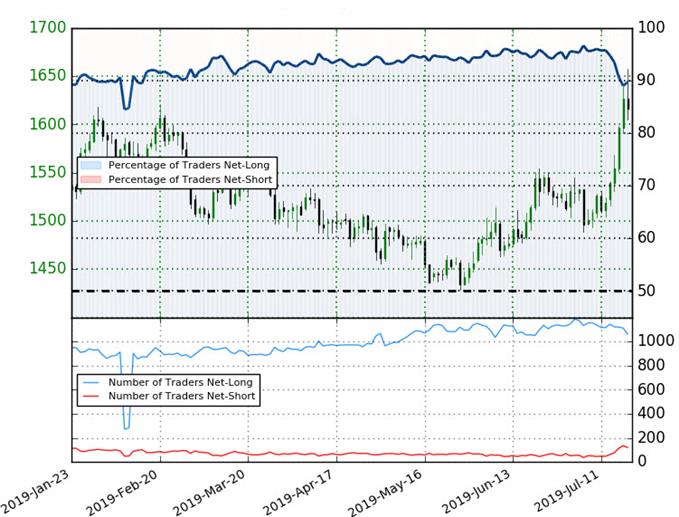
- A summary of IG Client Sentiment shows traders are net-long Spot Silver - the ratio stands at a staggering +8.71 (89.7% of traders are long) – bearish reading
- Long positions are 2.5% higher than yesterday and 8.5% lower from last week
- Short positions are 8.3% lower than yesterday and 106.8% higher from last week
- We typically take a contrarian view to crowd sentiment, and the fact traders are net-long suggests Spot Silver prices may continue to fall. Traders are further net-long than yesterday & last week, and the combination of current positioning and recent changes gives us a stronger Silver (XAG/USD)-bearish contrarian trading bias from a sentiment standpoint.


