
Silver And The Yield Curve Inversion
Yield curve inversions have historically been great for silver prices. Currently, we are experiencing such a phenomenon, and again it is evidence of conditions that are conducive to some impressive silver rallies.
Below is a long-term chart showing the spread between the 10-year Treasury Note Yield and the 3-month Treasury Bill Rate.
(Click on image to enlarge)
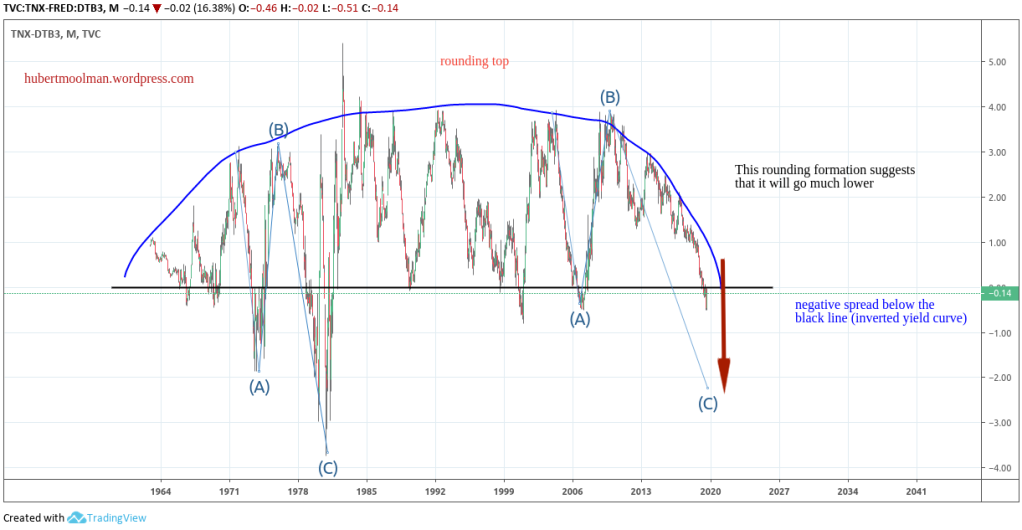
I have chosen these two to show data for long-term analysis. There appears to be a mega rounding top. The spread has just recently gone negative (inverted). There is a great likelihood that the spread could go lower, given the rounding top and a similarity to the 70s pattern (ABC).
Silver has already started to move, but what kind of rally can we expect going forward? Previously, I have argued that we are likely to see a rally similar to the late 70s.
Below, is a comparison of the above chart and a long-term silver chart to:
(Click on image to enlarge)
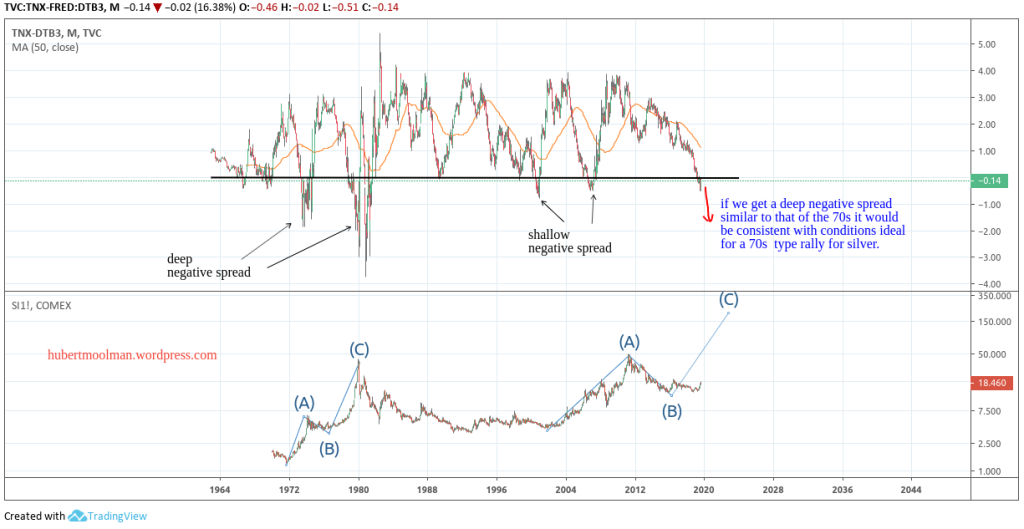
Notice how there were two deep negative spread dives in the 70s. As soon as those spreads went negative the first time during those inversions, silver started a massive rally.
As soon as the current inversion started, silver also started to rally. Will we have a shallow negative spread dive like the two recent ones, or will we see a deep and protracted negative spread dive like that of the 70s?
A deep dive like the 70s would be consistent with conditions ideal for a monster silver rally.
For more on this and this kind of fractal analysis, you are welcome to subscribe to my premium service. I have also ...
more

