
Should Weak November Payrolls Please Gold Bulls?
155,000. The November job gains disappointed. But the unemployment rate remained at 3.7 percent. What does it all mean for the gold market?
Job Creation Disappoints, but Unemployment Rate Is Still Low
U.S. nonfarm payrolls slowed down in November. The economy added just 155,000 jobs last month, following a rise of 227,000 in October (after a downward revision). Moreover, the weak headline number was accompanied by significant negative revisions in October and September. With those, employment gains in these two months combined were 12,000 lower than previously reported. In consequence, after revisions, job gains have averaged 170,000 per month over the last three months, or 209,000 over the prior 12 months.
The headline number was significantly below the expectations, as economists polled by MarketWatch had forecast a 190,000 gain in nonfarm jobs. However, the gains were still great. Actually, November was the 97th consecutive month of job creation, the longest streak on record in the U.S. economy.
The gains were widespread, but the most impressive expansion occurred in education and health services (+34,000), professional and business services (+32,000), and in manufacturing (+27,000). On the contrary, information (-8,000), government (-6,000) and mining (-3,000) cut jobs in November.
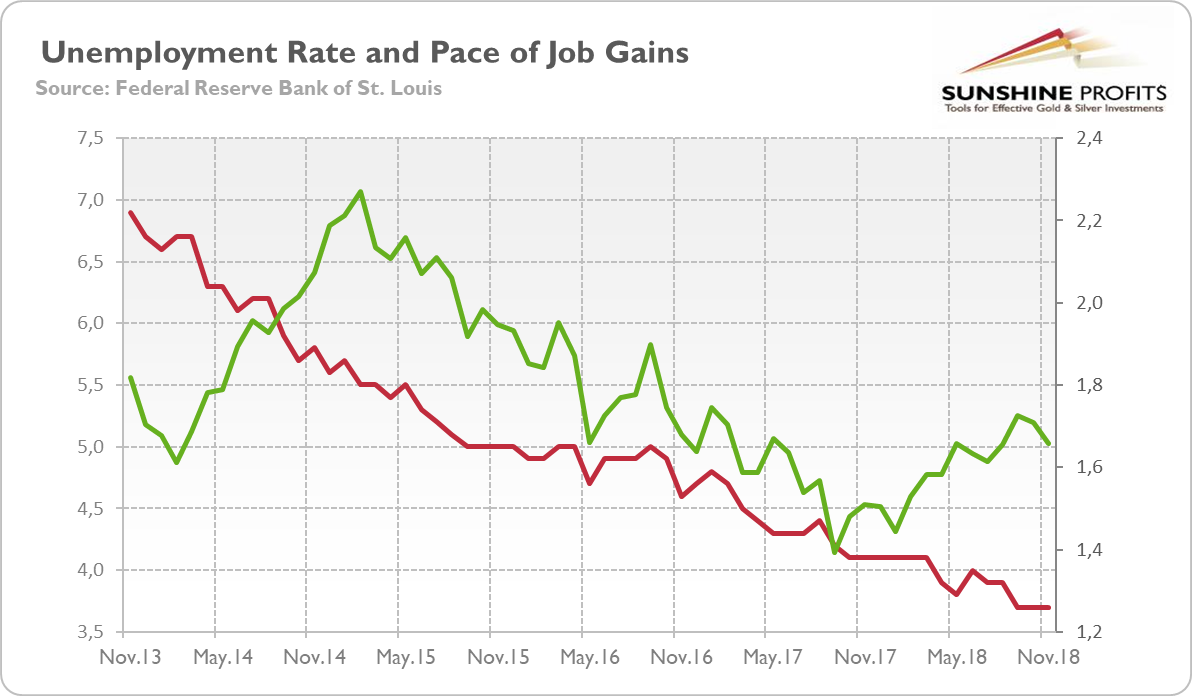
On an annual basis, the annual pace of job creations decreased slightly last month, as one can see in the chart below. However, it was sufficient to kept the unemployment rate unchanged at 3.7 percent, the lowest level since 1969, for the third month in a row.
Chart 1: U.S. unemployment rate (red line, left axis, U-3, in %) and total nonfarm payrolls percent change from a year ago (green line, right axis, % change from year ago) from November 2013 to November 2018.
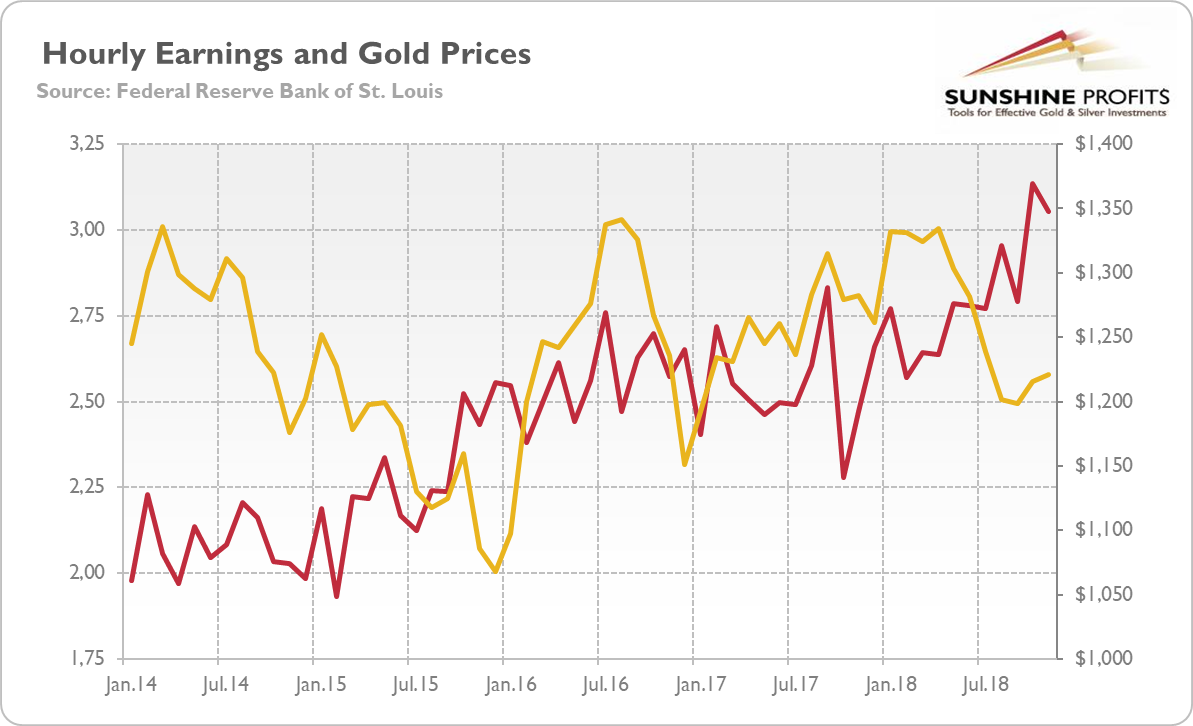
Moreover, the average hourly earnings for all employees on private nonfarm payrolls rose by 6 cents to $27.35. It implies that they increased 3.1 percent over the prior twelve months, slightly slower than last month. However, as the next chart shows, the pace of wage inflation remained very close to the fastest pay gains since 2009. Rising wages should be welcome by the hawks among the Federal Reserve.
Chart 2: Average hourly earnings of all private employees (red line, left axis, percent change from the year ago) and gold prices (yellow line, right axis, London P.M. Fix), from January 2014 to November 2018.
Implications for Gold
Despite the weak headline job gains, November edition of the Employment Situation Report was solid. The payrolls were still significantly above the level needed for a gradual tightening of the labor market. Although 155,000 jobs fell short of expectations, the number was two times higher than the economy needs to keep the unemployment rate steady. Indeed, the unemployment rate remained at the lowest level since December 1969 for the third month in a row. And the wages continued to grow relatively fast. All that means that the US labor market remains healthy, contributing to the economic expansion. Hence, the FOMC should stay on track to continue gradually raising interest rates, with the next hike in the federal funds rate to come in one week. With the market odds of a hike in December meeting at three fourths, we would be very surprised if the Fed chickens out.
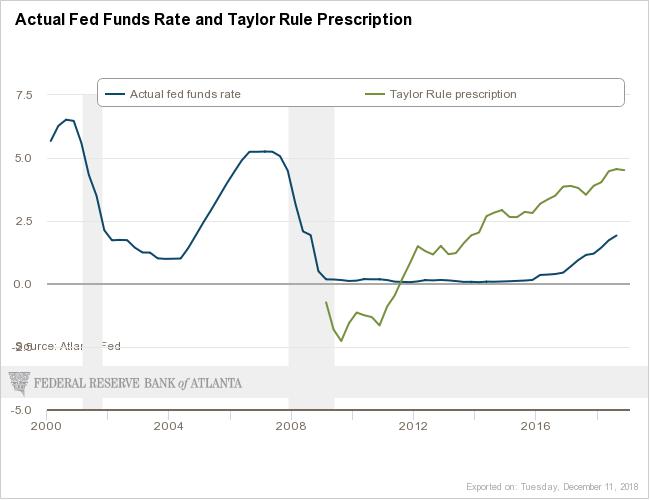
However, the US central bank’s strategy in 2019 is less clear, as some Fed officials adopted a more cautious tone, suggesting that we might be close to the neutral level of interest rates. But that’s not true. Let’s look at the Taylor rule, which is often used as a reference point to assess or guide the monetary policy.
As one can see in the chart below, the federal funds rate should be 4.52 percent, according to the Taylor rule. Now, it stays at 2.20 percent, much lower level. It suggests that we are far from the neutral level. We know, of course, that there are many actual estimations of the Taylor rule, but all of them are higher than the current level – and most of them suggest at least three further hikes in 2019.
Chart 3: Actual federal funds rate and Taylor rule prescription from 2000 to 2018.
Hence, given the labor market’s strength, the Fed should continue its policy of gradual tightening. It means that gold should remain under downward pressure from the monetary policy. The appreciation of the US dollar against the British pound due to the fresh Brexit-related turmoil should also be not very helpful for the yellow metal. The hope is that next year investors will look into 2020 – and then the Fed could really be more dovish. Next week, after the Fed’s economic projections, the outlook for the gold market will be clearer – stay tuned!
If you enjoyed the above analysis and would you like to know more about the most important macroeconomic factors influencing the U.S. dollar value and the price of gold, we invite you to read the ...
more

