
Should Retirees Worry About Bear Markets?
Mark Hulbert recently wrote a piece suggesting “Retirees Should Not Fear A Bear Market.” To Wit:
“Don’t give up hope.
I’m referring to what many retirees are most afraid of: Running out of money before they die. An Allianz Life survey found that far more retirees are afraid of outliving their money than they are of dying—61% to 39%. This ever-present background fear is especially rearing its ugly head right now, given the bear market that too many came out of nowhere.
Retirement planning projections made at the end of the third quarter, right as the stock market was registering its all-time highs, now need to be revised.
The reason not to give up hope is that the stock market typically recovers from bear markets in a far shorter period of time than most doom and gloomers think. Consider what I found when measuring how long it took, after each of the 36 bear markets since 1900 on the bear market calendar maintained by Ned Davis Research…Believe it or not, the average recovery time was ‘just’ 3.2 years.”
Mark correctly used total return numbers in his calculations, however, while his data is correct the conclusion is not.
Here is why.
While Mark is discussing the recovery of bear markets (getting back to even) it is based on a “buy and hold”investing approach.
However, Mark’s error is that he is specifically discussing “retirees” which are systematically withdrawing capital from their portfolios, paying tax on those withdrawals (from retirement accounts) and compensating for adjustments to the cost of living (not to mention spiraling “health care” costs.)
These are the same problems which plague most of the “off the shelf” financial plans today:
- Faulty assumptions based on average historic rates of returns rather than variable rates of return, and;
- Not accounting for the current level of market valuations at the outset of the planning process.
To explain the problems with both Mark’s assumptions, and the vast majority of financial plans spit out of computer programs today, let’s turn to some previous comments from Michael Kitces.
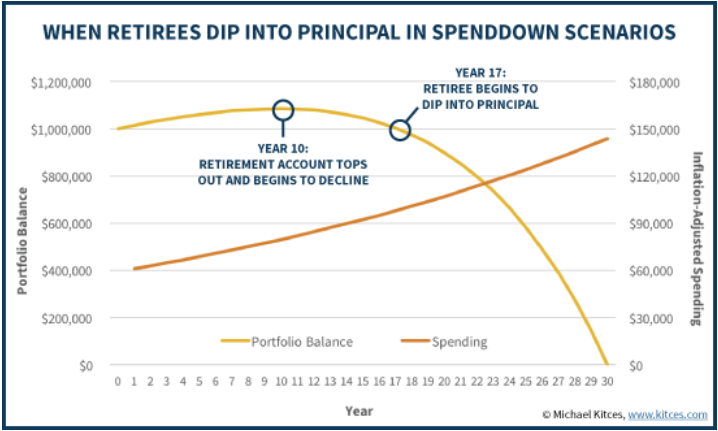
“Given the impact of inflation, it’s problematic to start digging into retirement principal immediately at the start of retirement, given that inflation-adjusted spending needs could quadruple by the end of retirement (at a 5% inflation rate). Accordingly, the reality is that to sustain a multi-decade retirement with rising spending needs due to inflation, it’s necessary to spend less than the growth/income in the early years, just to build enough of a cushion to handle the necessary higher withdrawals later!
For instance, imagine a retiree who has a $1,000,000 balanced portfolio, and wants to plan for a 30-year retirement, where inflation averages 3% and the balanced portfolio averages 8% in the long run. To make the money last for the entire time horizon, the retiree would start out by spending $61,000 initially, and then adjust each subsequent year for inflation, spending down the retirement account balance by the end of the 30th year.”
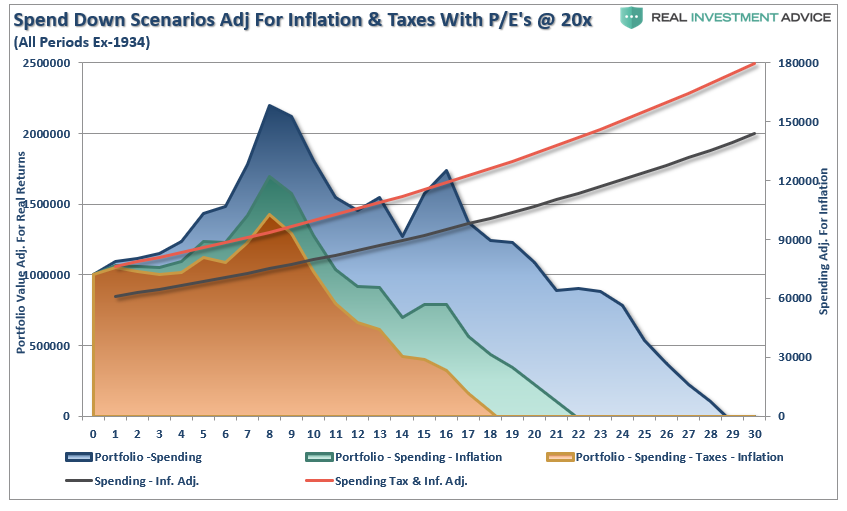
Michael’s assumptions on expanding inflationary pressures later in retirement is correct, however, they don’t take into account the issue of taxation. So, let’s adjust Kitces’ chart and include not only the impact of inflation-adjusted returns but also taxation.
The chart below adjusts the 8% return structure for inflation at 3% and also adjusts the withdrawal rate up for taxation at 25%.
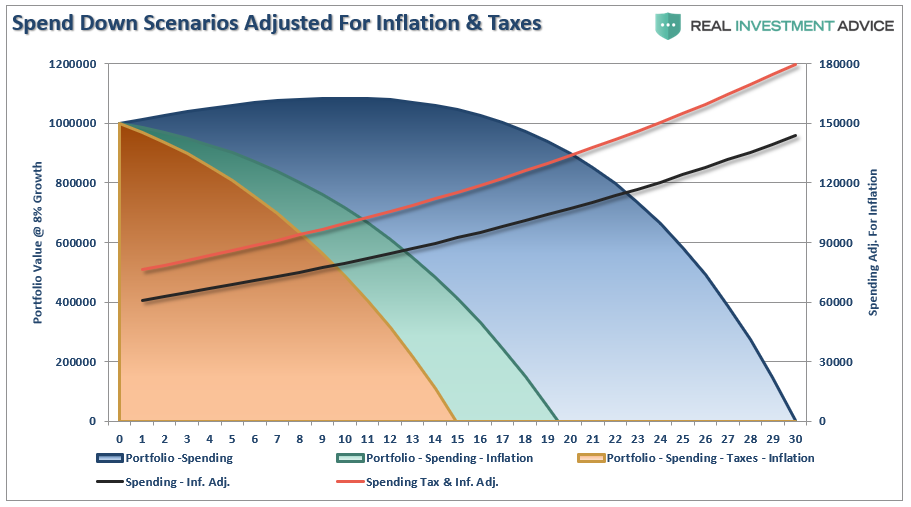
By adjusting the annualized rate of return for the impact of inflation and taxes, the life expectancy of a portfolio grows considerably shorter.
While inflation and taxes are indeed important to consider, those are not the biggest threat to retiree’s portfolios.
There is a massive difference between 8% “average” rates of return and 8% “actual” returns.
The Impact Of Variability
Currently, the S&P 500 (as of 1/18/19) is trading at 2,670 with Q4-2018 trailing reported earnings estimated to be $139.50. (S&P Data) This puts the 10-year average trailing P/E ratio of the S&P at a rather lofty 28.86x.
We also know that forward returns from varying valuation levels are significantly varied depending on when you start your investing. As shown in the chart below, from current valuation levels, forward returns from the market have been much closer to 2% rather than 8%.
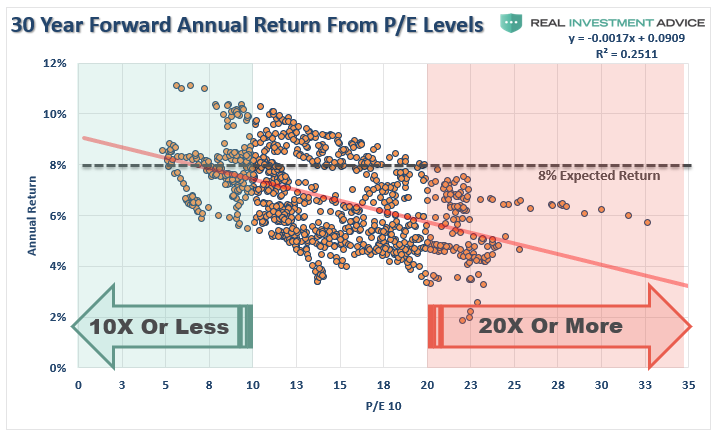
As evidenced by the graph, as valuations rise future rates of annualized returns fall. This should not be a surprise as simple logic states that if you overpay today for an asset, future returns must, and will, be lower.
Math also proves the same. Capital gains from markets are primarily a function of market capitalization, nominal economic growth plus the dividend yield. Using the Dr. John Hussman’s formula we can mathematically calculate returns over the next 10-year period as follows:
(1+nominal GDP growth)*(normal market cap to GDP ratio / actual market cap to GDP ratio)^(1/10)-1
Therefore, IF we assume that
- GDP maintains, 4% annualized growth indefinitely
- Which means recessions have been eliminated, AND
- Current market cap/GDP stays flat at 1.25, AND
- The current dividend yield remains at 2%:
We would get forward returns of:
(1.04)*(.8/1.25)^(1/30)-1+.02 = 4.5%
But there’s a “whole lotta ifs” in that assumption.
More importantly, if we assume that inflation remains stagnant at 2%, as the Fed hopes, this would mean a real rate of return of just 2.5%.
This is far less than the 8-10% rates of return currently promised by the Wall Street community. It is also why starting valuations are critical for individuals to understand when planning for the accumulation phase of the investment life-cycle.
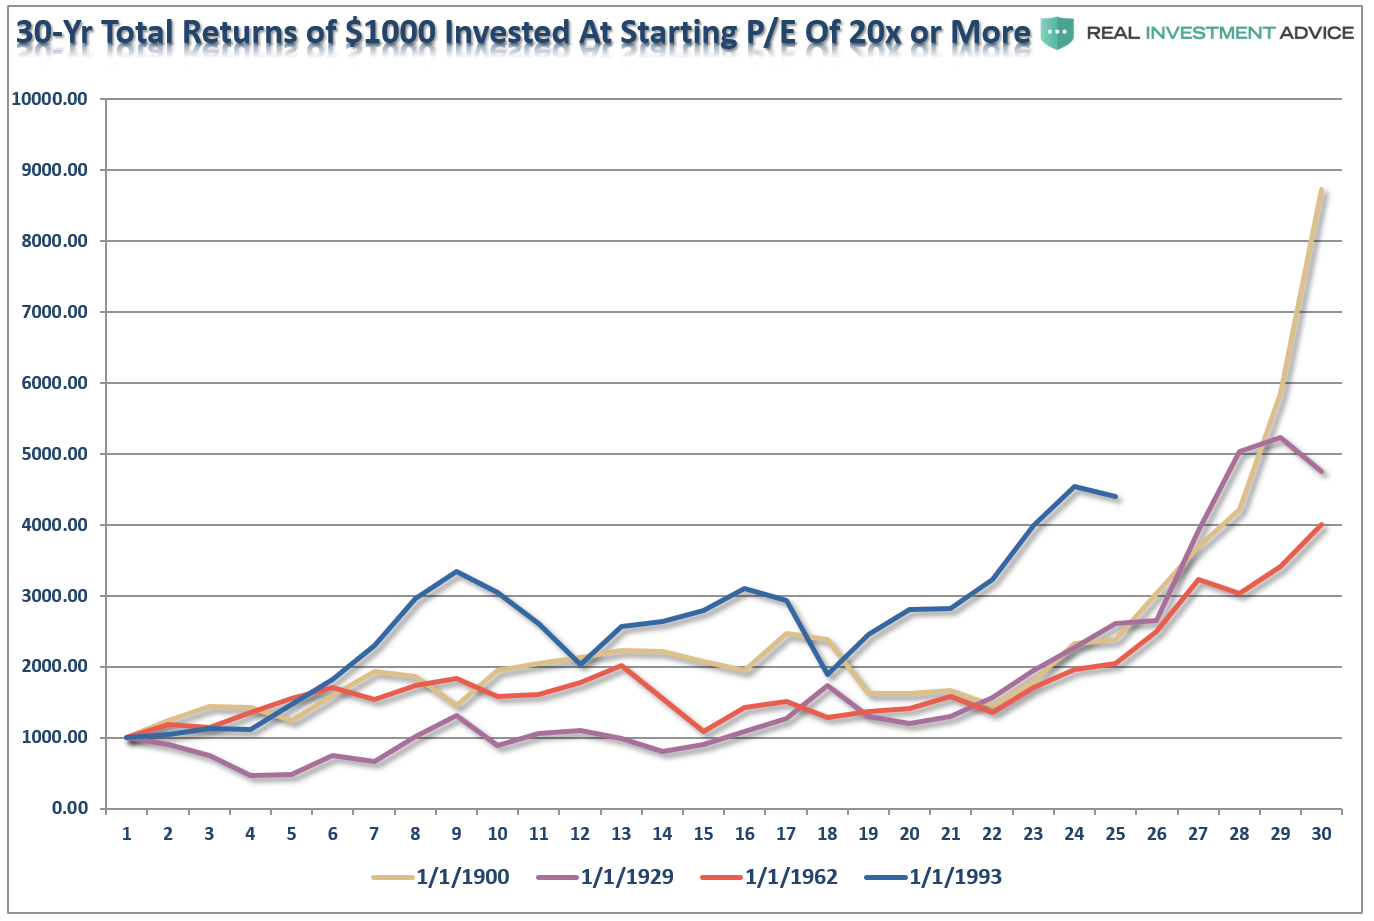
Let’s take this a step further. For the purpose of this article, we went back through history and pulled the 4-periods where trailing 10-year average valuations (Shiller’s CAPE) were either above 20x earnings or below 10x earnings. We then ran a $1000 investment going forward for 30-years on a total-return, inflation-adjusted, basis.
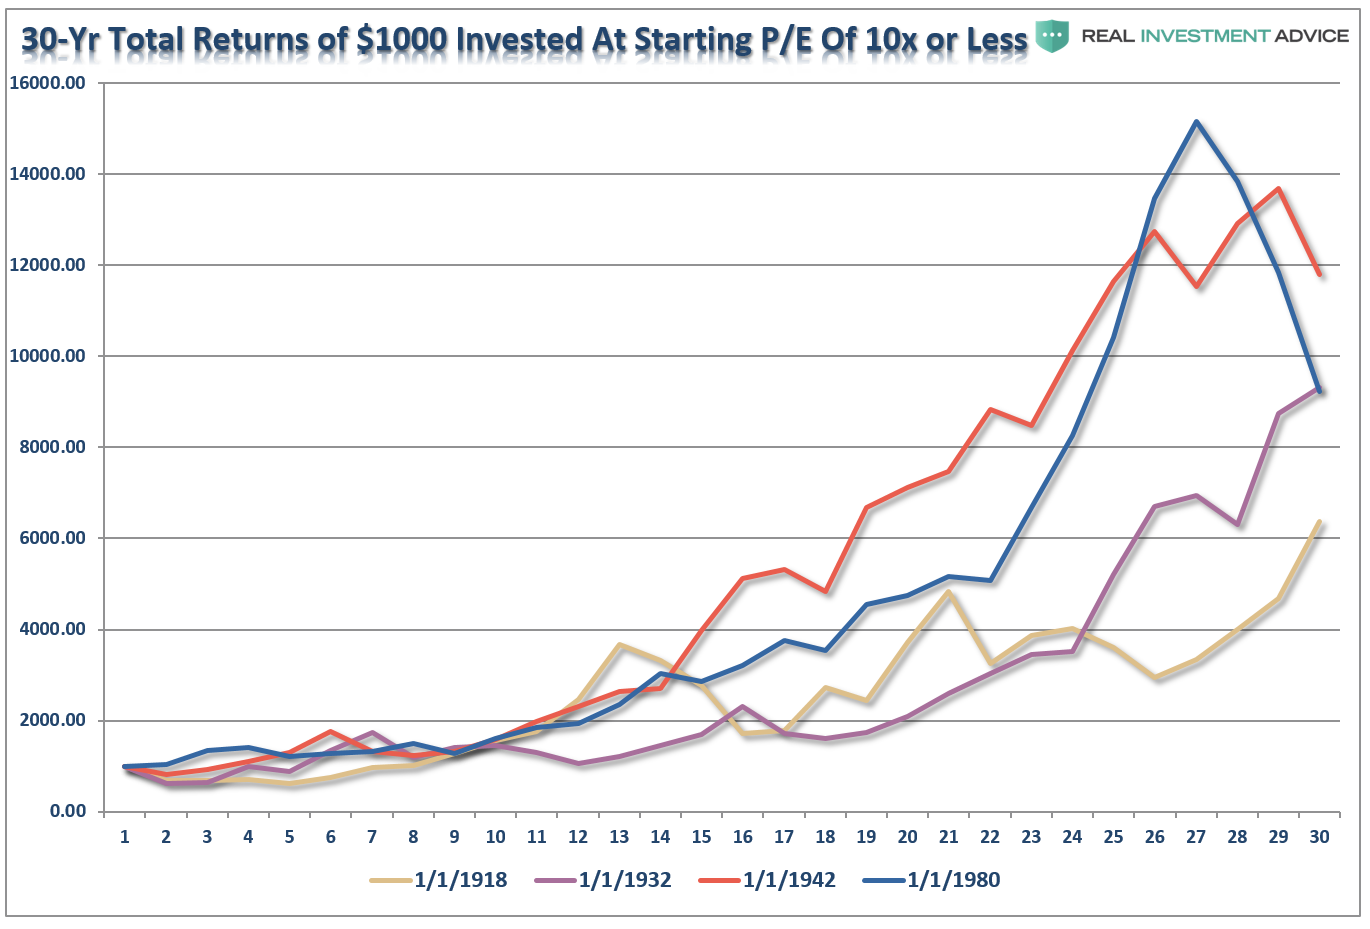
At 10x earnings, the worst performing period started in 1918 and only saw $1000 grow to a bit more than $6000. The best performing period was actually not the screaming bull market that started in 1980 because the last 10-years of that particular cycle caught the “dot.com” crash. It was the post-WWII bull market that ran from 1942 through 1972 that was the winner. Of course, the crash of 1974, just two years later, extracted a good bit of those returns.
Conversely, at 20x earnings, the best performing period started in 1900 which caught the rise of the market to its peak in 1929. Unfortunately, the next 4-years wiped out roughly 85% of those gains. However, outside of that one period, all of the other periods fared worse than investing at lower valuations. (Note: 1993 is still currently running as its 30-year period will end in 2023.)
The point to be made here is simple and was precisely summed up by Warren Buffett:
“Price is what you pay. Value is what you get.”
This idea becomes much clearer by showing the value of $1000 invested in the markets at both valuations BELOW 10x trailing earnings and ABOVE 20x. I have averaged each of the 4-periods above into a single total return, inflation-adjusted, index, Clearly, investing at 10x earnings yields substantially better results.
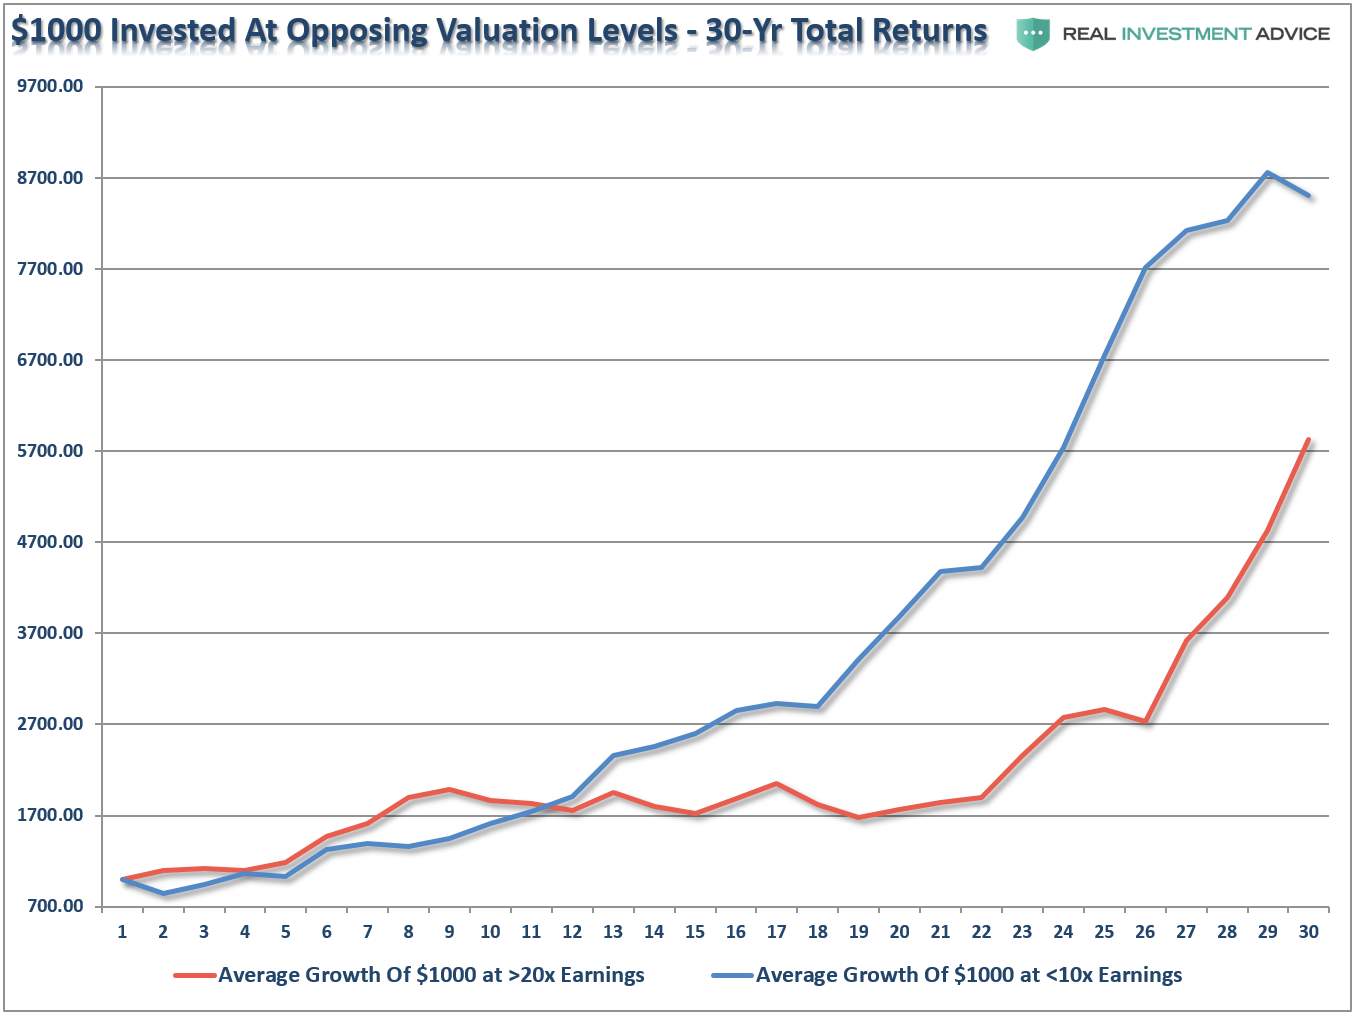
Not surprisingly, the starting level of valuations has the greatest impact on your future results.
But, most importantly, starting valuations are critical to withdrawal rates
When we adjust the spend down structure for elevated starting valuation levels, and include inflation and taxation, a much different, and far less favorable, financial outcome emerges – the retiree runs out of money not in year 30, but in year 18.
As John Coumarionos previously wrote:
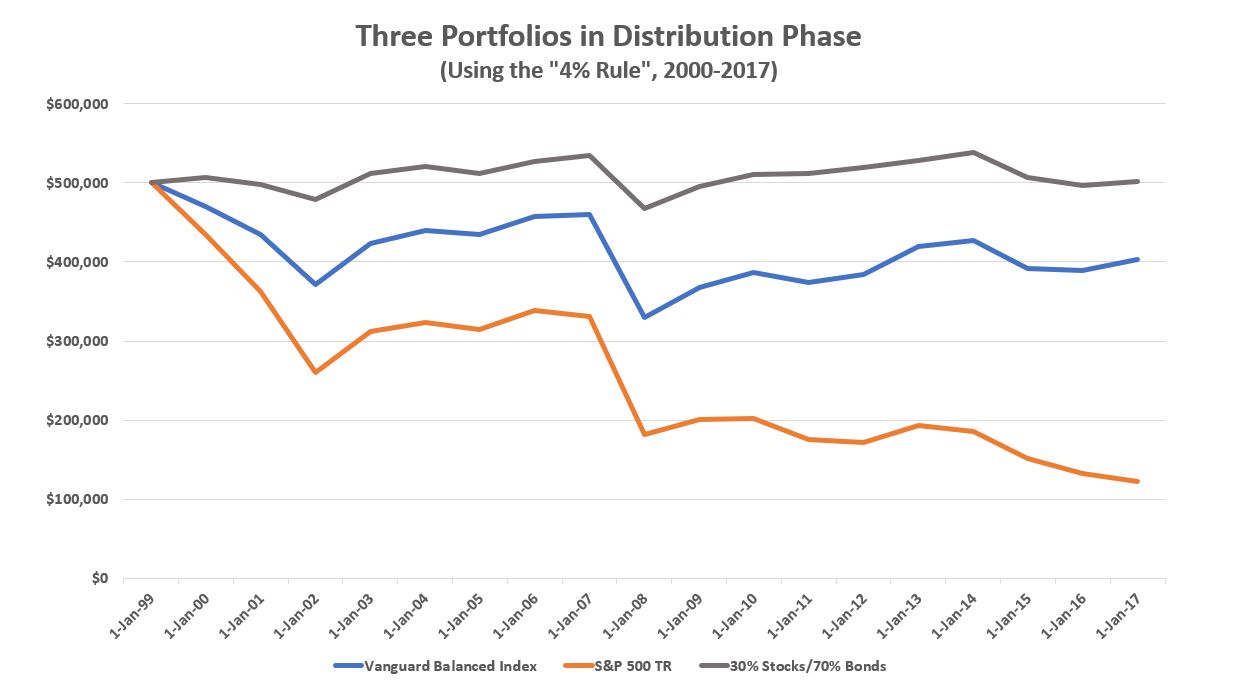
“And, if you’re retired and withdrawing from your portfolio, the ‘sequence-of-return’ risk – the problem of the early years of withdrawals coinciding with a declining portfolio – can upend your entire retirement. That’s because a portfolio in distribution that experiences severe declines at the beginning of the distribution phase, cannot recover when the stock market finally rebounds. Because of the distributions, there is less money in the portfolio to benefit from stock gains when they eventually materialize again.
I showed that risk in a previous article where I created the following chart representing three hypothetical portfolios using the ‘4% rule’ (withdrawing 4% of the portfolio the first year of retirement and increasing that withdrawal dollar value by 4% every year thereafter). I cherry-picked the initial year of retirement, of course (2000), so that my graphic represents a kind of worst case, or at least a very bad case, scenario. But investors close to retirement should keep that in mind because current stock prices are historically high and bond yields are historically low. That means the prospects for big investment returns over the next decade are dim and that increasing stock exposure could be detrimental to retirement plans once again. In my example, decreasing stock exposure benefits the portfolio in distribution phase, and that could be the case for retirees now.”
As John correctly notes, there is a case for owning stocks in a retirement portfolio, just maybe not as much as your “run of the mill” financial plan suggests. To wit:
“Returns from cash and bonds may not keep up with inflation, after all. But stock returns might fall short too. And if stocks do lag, they probably won’t do so with the limited volatility that bonds tend to deliver, barring a serious bout of inflation. So, if you’re within a decade of retirement, it may be time to think hard about how much stock exposure is enough. The answer might be less than you think for a portfolio in distribution phase.”
Questions Retirees Need To Ask About Plans
Importantly, what this analysis reveals, is that “retirees” SHOULD be worried about bear markets. Taking the correct view of your portfolio, and the risk being undertaken, is critical when entering the retirement and distribution phase of the portfolio life cycle.
More importantly, when building and/or reviewing your financial plan – these are the questions you must ask and have concrete answers for:
- What are the expectations for future returns going forward given current valuation levels?
- Should the withdrawal rates be downwardly adjusted to account for potentially lower future returns?
- Given a decade long bull market, have adjustments been made for potentially front-loaded negative returns?
- Has the impact of taxation been carefully considered in the planned withdrawal rate?
- Have future inflation expectations been carefully considered?
- Have drawdowns from portfolios during declining market environments, which accelerates principal bleed, been considered?
- Have plans been made to harbor capital during up years to allow for reduced portfolio withdrawals during adverse market conditions?
- Has the yield chase over the last decade, and low interest rate environment, which has created an extremely risky environment for retirement income planning been carefully considered?
- What steps should be considered to reduce potential credit and duration risk in bond portfolios?
- Have expectations for compounded annual rates of returns been dismissed in lieu of a plan for variable rates of future returns?
If the answer is “no” to the majority of these questions then feel free to contact one of the CFP’s in our office who take all of these issues into account.
With debt levels rising globally, economic growth on the long-end of the cycle, interest rates rising, valuations high, and a potential risk of a recession, the uncertainty of retirement plans has risen markedly. This lends itself to the problem of individuals having to spend a bulk of their “retirement” continuing to work.
Two previous bear markets have devastated the retirement plans of millions of individuals in the economy today which partly explains why a large number of jobs in the monthly BLS employment report go to individuals over the age of 55.
So, not only should retirees worry about bear markets, they should worry about them a lot.
Disclosure: The information contained in this article should not be construed as financial or investment advice on any subject matter. Real Investment Advice is expressly disclaims all liability ...
more

