
Shiller: ECY & Justification For Sky-High Stock Prices
In a recent interview, Dr. Robert Shiller justified “sky-high” stock prices by using a measure called the “Earnings CAPE yield” or ECY. To wit:
“There has been much puzzlement that the world’s stock markets haven’t collapsed in the face of the COVID-19 pandemic. Especially in the United States, which has recently been setting record highs for new cases. But maybe it isn’t such a puzzle. A measure we call the Excess CAPE Yield (ECY) puts the long-term outlook for the world’s stock markets in better perspective.” – Shiller
Before we dig further into his analysis, it is essential to review what we have previously stated about valuations. As discussed earlier in “Shiller’s CAPE – Is It Just B.S.”
The problem is that valuation models are not, and were never meant to be, ‘market timing indicators.’ The vast majority of analysts assume that if a measure of valuation (P/E, P/S, P/B, etc.) reaches some specific level it means that:
- The market is about to crash, and;
- Investors should be in 100% cash.
Such is incorrect. Valuation measures are simply just that – a measure of current valuation. More, importantly, when valuations are excessive, it is a better measure of ‘investor psychology’ and a manifestation of the ‘greater fool theory.’”
What valuations do provide is a reasonable estimate of long-term investment returns. It is logical that if you overpay for a stream of future cash flows today, your future return will be lower.
“Price is what you pay. Value is what you get.” – Warren Buffett
Markets Are Expensive
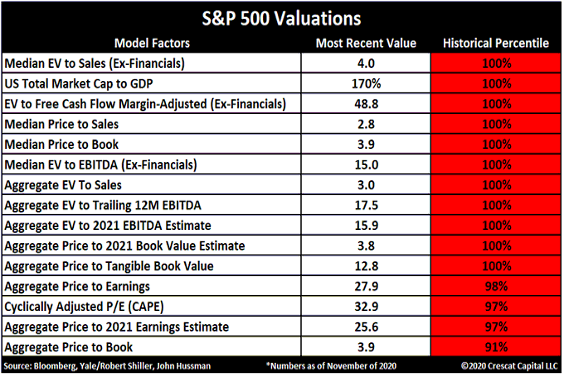
Doug Kass recently made a salient point:
“By taking rates to zero and providing excess liquidity has made the price-earnings multiplier, determined by a near-zero risk-free rate of return, an unknown quantity. Like a projectile capable of taking those valuations to unrecognizable levels, at least based on history.
This despite a mountain of global debt and numerous other secular and structural headwinds. The table of 15 stock market valuation factors show 11 at record levels. The other four are at all-time highs.”
What does history tell us about future returns when multiple valuation measures are high? The scatter chart below compares forward 10-year returns against four measures. They are Price To Sales, Tobin’s-Q, Shiller’s CAPE, and Market-Cap To GDP. (Read “Do You Feel Lucky” for more detail)
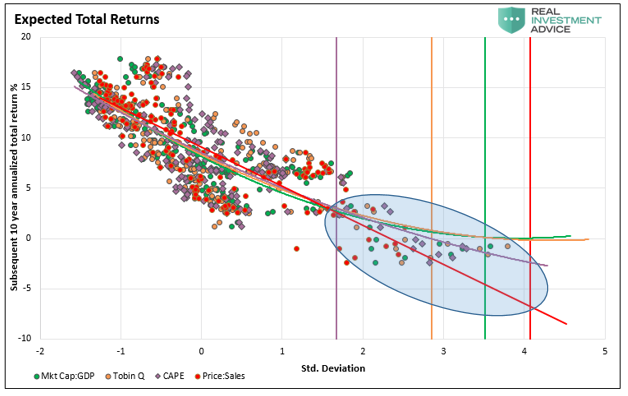
With expected returns falling between +2 and -3% over the next decade, meeting retirement goals will be challenging.
However, while valuations dictate long-term returns, it is all about the narrative near-term. Such was the point made by Shiller.
Indisputably, asset markets are substantially driven by psychology and narratives. As the Nobel laureate Daniel Kahneman wrote, ‘familiarity breeds liking.’ Several familiar narratives have emerged in the world’s stock markets this year.
There is the V-shaped recovery narrative and the FOMO (fear of missing out) narrative. Both might be helping to drive markets to new highs.
But are these narratives the only reason?
So, if it isn’t just the short-term psychological narrative driving stocks, then is there a fundamental reason? Shiller supplied his thesis.
Shiller’s Assumption
“So, interest-rate cuts by central banks may be used to justify higher equity prices and CAPE ratios.
Thus, the level of interest rates is an increasingly important element to consider when valuing equities. To capture these effects and compare investments in stocks versus bonds, we developed the ECY. The ECY considers both equity valuation and interest-rate levels. To calculate the ECY, we simply invert the CAPE ratio to get a yield and then subtract the 10-year real interest rate.
The “rationalization” that low rates justify high valuations is but one of several arguments used to justify overpaying for assets. While such analysis may provide the “justification” in the short-term, does it produce higher prices over the next decade?
To answer that question, we need to start with the inverse of the CAPE ratio, the Earning CAPE Yield (ECY). As shown, the CAPE ratio’s inverse is an earnings yield of just slightly less than 4%.
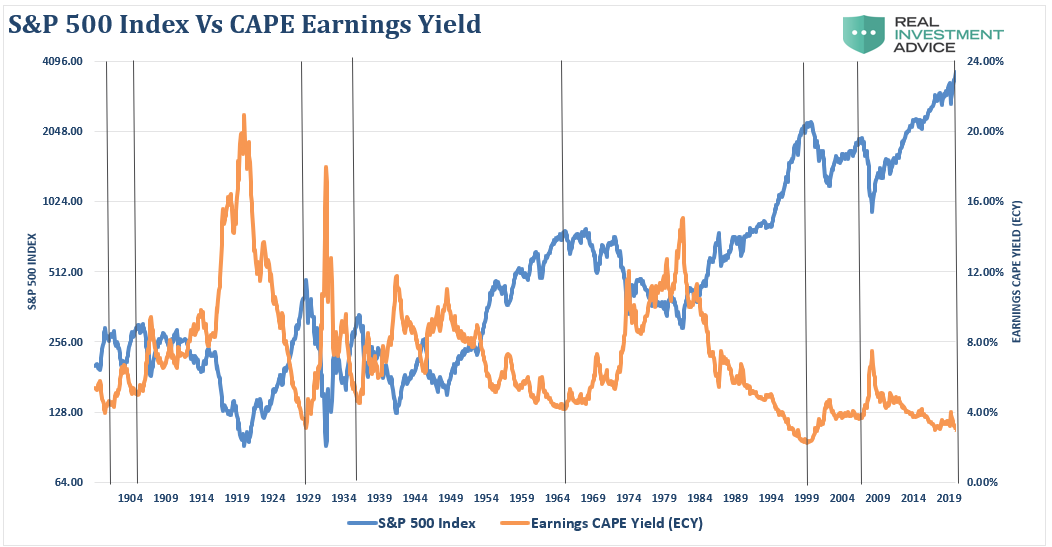
It is worth noting that historically when the ECY has been at current levels or lower, it has tended to align with peaks of “bull markets.” Since elevated CAPE ratios align with market peaks, it is not surprising that inverting the calculation shows the same.
But does adjusting for interest rates alter the outcome?
All Rates Are Not Equal
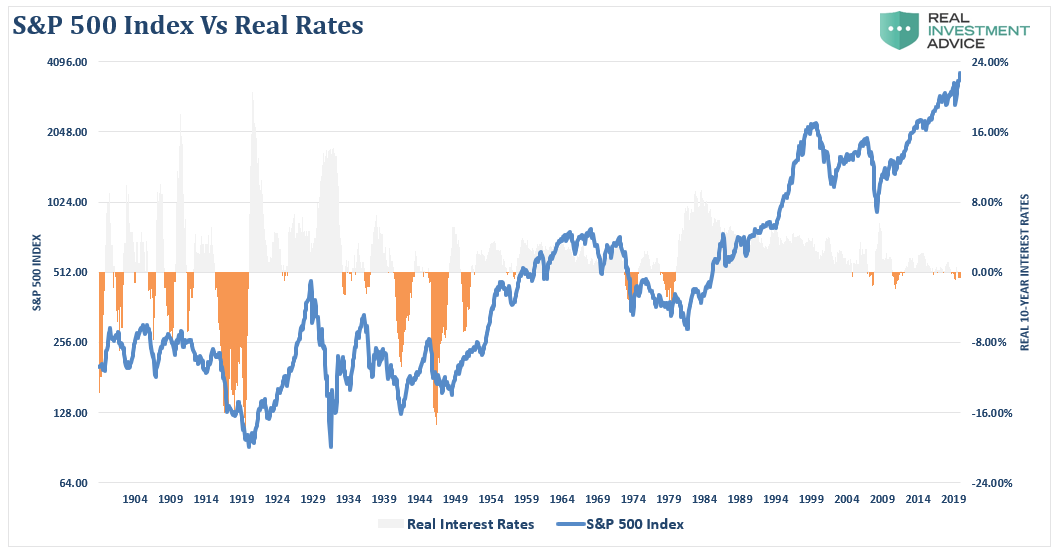
The chart below takes 10-year interest rates and adjusts for the average 10-year inflation rate.
As we have seen with Europe, negative interest rates are not suitable for either economic growth or markets. While the theory is that low-interest rates allow for cheaper borrowing, which can be used productively for investments, there is a point where low-interest rates become economically destructive. Such is the case currently, as discussed in “Fed Is Stuck With Forever Stimulus:”
“In 1998, the Federal Reserve “crossed the ‘Rubicon,’ whereby lowering interest rates failed to stimulate economic growth or inflation as the “debt burden” detracted from it. When compared to the total debt of the economy, monetary velocity shows the problem facing the Fed.”
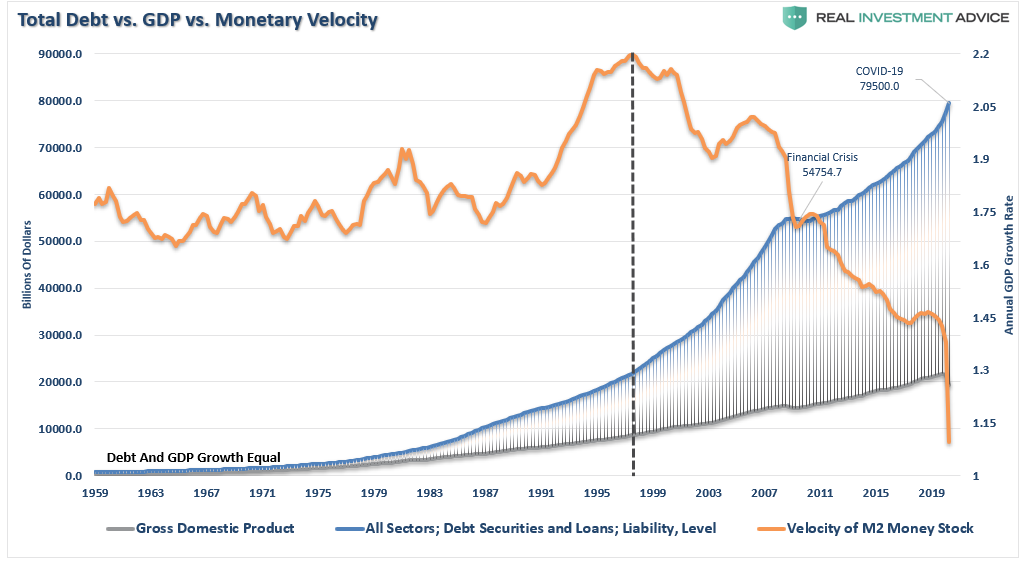
As low-interest rates went lower, the dynamic changed from using debt productively to using debt for non-productive purposes such as dividend issuance, share buybacks, and, in some cases, offsetting negative cash flows.
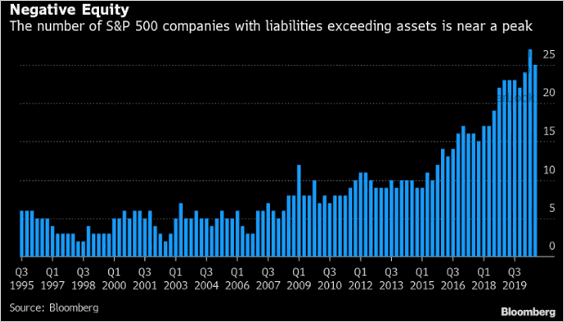
In an economy laden by $75 Trillion in debt, a record number of “Zombie” companies kept alive only by low borrowing costs, and a near-record number of companies with negative equity, higher rates are a ‘death knell.’”
The point here is that while there is certainly justification for discounting valuations for the level of interest rates, all rates are not equal. As noted, low-rates, and particularly negative real rates, are typically associated with more destructive periods of economic and market cycles.
Adjusting For Negative Rates
With this background, do ultra-low, and specifically, negative interest rates, justify higher valuations? Such was the point Dr. Shiller made:
“The ECY in the U.S., for example, is 4%, derived from a CAPE yield of 3% and then subtracting a 10-year real interest rate of -1.0% (adjusted using the preceding 10 years’ average inflation rate of 2%).
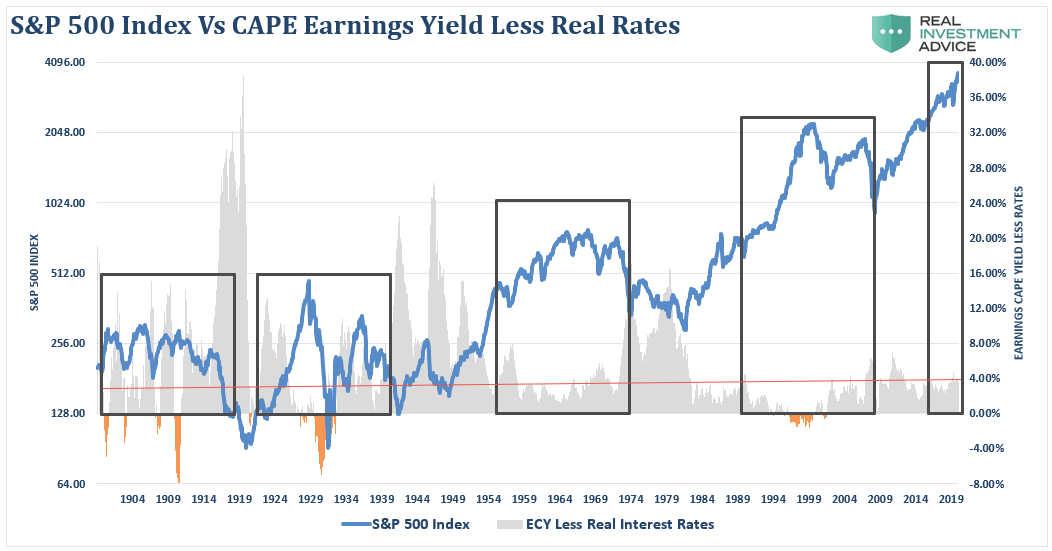
Eventually, down the line, bond yields may just rise, and equity valuations may also have to reset alongside yields. But, at this point, despite the risks and the high CAPE ratios, stock-market valuations may not be as absurd as some people think.”
While Dr. Shiller notes that eventually, equity valuations will have to reset, the short-term justification is that with 4% interest rate adjusted equity yields, stocks are cheap.
However, as noted by the boxes in the chart above, every previous period in history where the adjusted ECY was 4% or higher, such aligned with falling asset prices, declining valuations, and recessionary outcomes.
Discounting The Discount
The primary argument is that when inflation or interest rates fall, the present value of future cash flows from equities rises, and subsequently, so should their valuation. While true, assuming all else is equal, a falling discount rate does suggest a higher valuation.
However, when inflation declines, future nominal cash flow from equities also falls. Therefore, lower discount rates get offset as lower rates are applied to lower expected cash flows.
In other words, without adjusting for inflation and, in no small degree, economic growth, suggesting low rates justify overpaying for cash flows is a very flawed premise.
“Instead of regarding stocks as a fixed-rate bond with known nominal coupons, one must think of stocks as a floating-rate bond whose coupons will float with nominal earnings growth. In this analogy, the stock market’s P/E is like the price of a floating-rate bond. In most cases, despite moves in interest rates, the price of a floating-rate bond changes little, and likewise the rational P/E for the stock market moves little.” – Cliff Asness
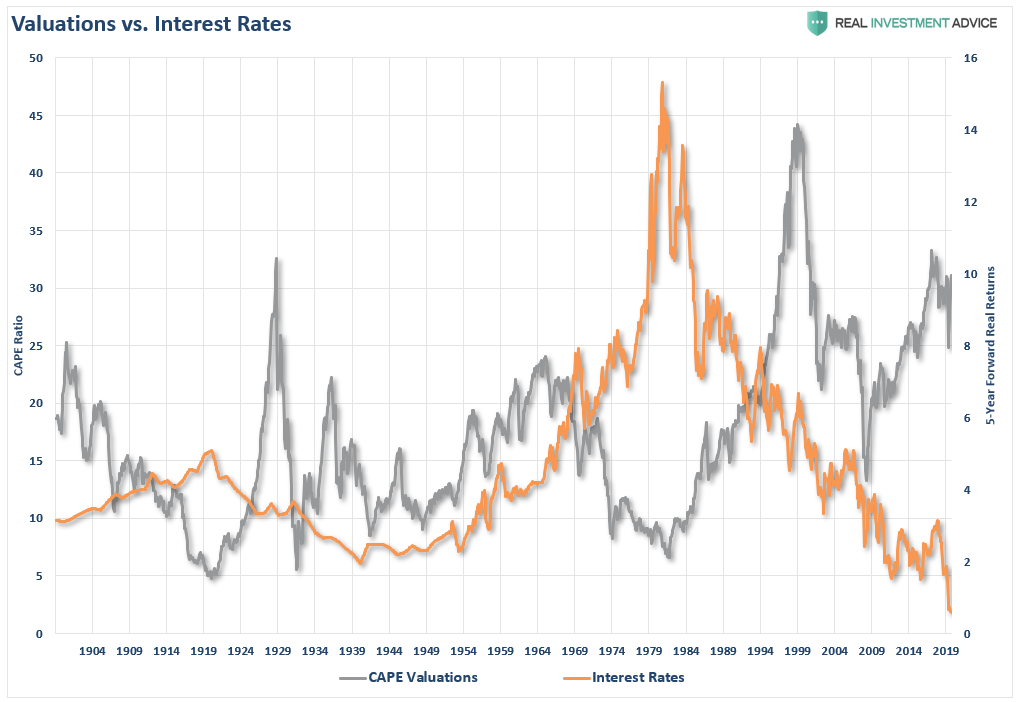
Historically, when interest rates or inflation are low, the stock market’s E/P is also low, as shown in the chart above.
There are just two times when interest rates were meager. The first was in the 1940s, and currently. In the 1940s, stock valuations were low, along with interest rates. Therefore, the statement that low-interest rates cause high valuations is a .500 batting average, equivalent to a coin-flip.
Don’t Take My Word For It.
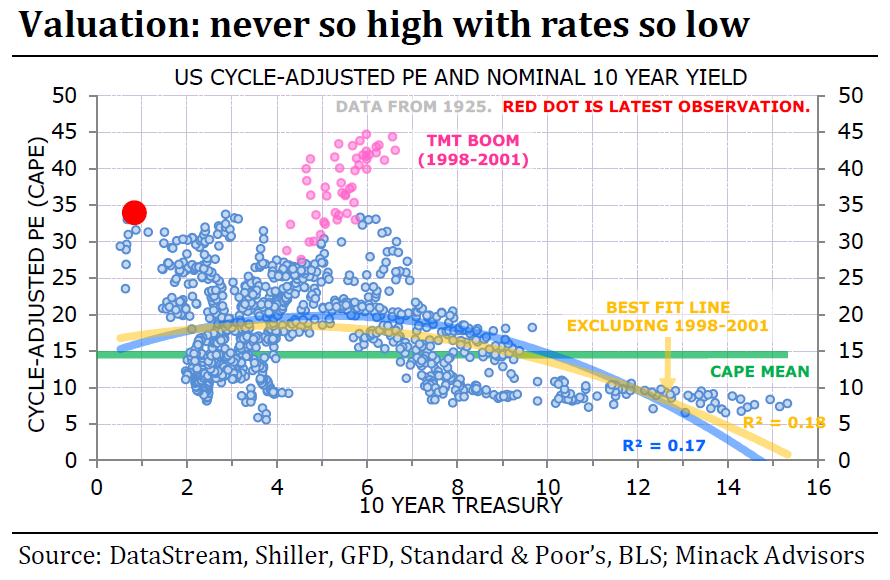
Gerard Minack, of Minack Advisors, also suggested Shiller’s theory is flawed.
“Do low-interest rates in their own right lead to higher earnings multiples? His answer is no; it’s not rational to bid up stocks just because rates are low. The reason is that not all else is equal.
Usually, interest rates are low because growth is bad, and when growth is bad that tends to be bad for equities. That leads to a curved relationship between rates and equities over time — when rates come down from very high levels, equity multiples tend to improve, but when rates then drop to very low levels, equity multiples fall because this generally means that the economy is mired in a recession.”
The following chart maps the CAPE on one scale against the 10-year yield on the other for every month since 1925. A quick look shows that the relationship between the two isn’t that strong. The best fit has an R-squared of only 0.12, meaning only a weak correlation:
Importantly, when the average economic growth rate is 2% or less, it fails to absorb new entrants into the market. As such, revenue growth remains weak, and companies have to resort to a host of accounting gimmicks to boost bottom-line earnings. In other words, there isn’t a tremendous difference between slow and no, economic growth.
As noted in “Why This Isn’t 1920,” the highest correlation between stock prices and future returns comes from valuations.
Conclusion
It is imperative to remember valuations are very predictive of long-term returns from the investment process. However, they are horrible timing indicators.
Beware the investment advisor, pundit, or superstar investor who is sure that low rates support incredibly high stock valuations. While I have tremendous respect for Dr. Shiller, he does not have to face clients for a loss of capital if his assumption turns out wrong.
There is much to debate about the current level of interest rates and future stock market returns. However, what is clear is the 40-year decline in rates did not mitigate two extremely nasty bear markets since 1998, just as falling rates did not mitigate the crash in 1929 and the subsequent depression.
Do low-interest rates justify high valuations?
History suggests they don’t.
Disclaimer: Click here to read the full disclaimer.


