
Sharp Rise In Owners’ Equity Can Help Economy, But Watch Out For Trend Reversal
US home prices continue to gallop ahead. There has been a marked increase in owners’ equity. This should buoy consumer sentiment and help the economy. The risk is when – not if – the trend reverses and goes the other way.
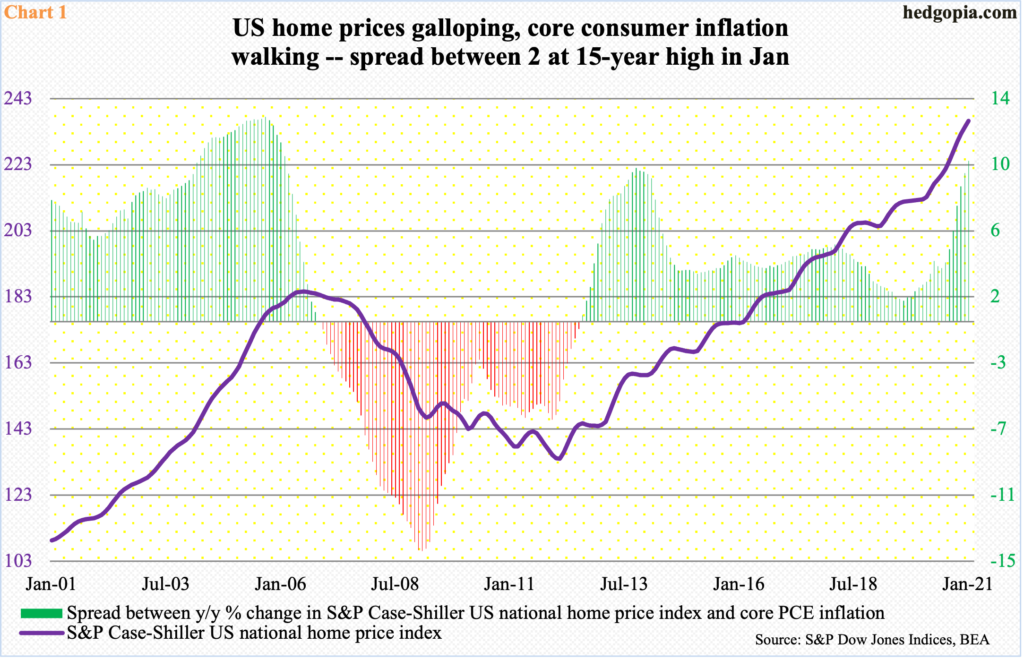
Home prices are inflating much faster than consumer inflation. As a matter of fact, there is no comparison between the two. In January, the S&P Case-Shiller National Home Price Index jumped 11.2 percent year-over-year, which was the sharpest appreciation in 15 years. This was the 17th month in a row price grew every month month-over-month.
In that same month, core PCE (personal consumption expenditures) – the Fed’s favorite measure of consumer inflation – rose 1.48 percent y/y, before softening further to 1.41 percent in February. Last April, core PCE dipped below one percent to 0.93 percent. It has risen since but remains below the two percent threshold, which is what the Fed aims to achieve.
As a result, the spread between home price appreciation and consumer inflation has gone vertical. In January, this was 9.7 percent – the widest since February 2006 (Chart 1). This is approaching the highs of the housing bubble of the first decade this century. In September 2005, the spread printed 12.4 percent before retreating – home price appreciation of 14.5 percent and core PCE of 2.1 percent.
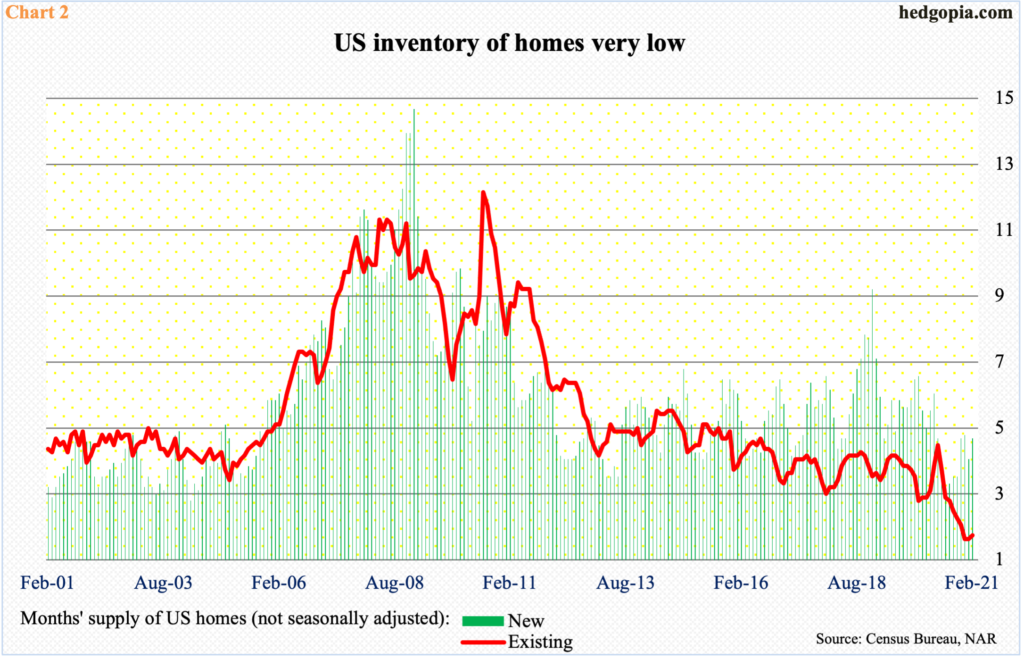
Low supply of homes is a major reason why home prices are skyrocketing. In February, there was two months’ inventory of existing homes and 4.8 months of new homes (Chart 2). Historically, this is a very low level of supply.
Besides, rates remain low. The Fed spends up to $120 billion/month in purchasing mortgage-backed securities and treasury notes and bonds. The 30-year fixed mortgage rate remained under three percent since last August before rising slightly past that level in late February, as long rates rallied hard.
The pace of home price appreciation has gotten so steep that sustainability increasingly is a question mark.
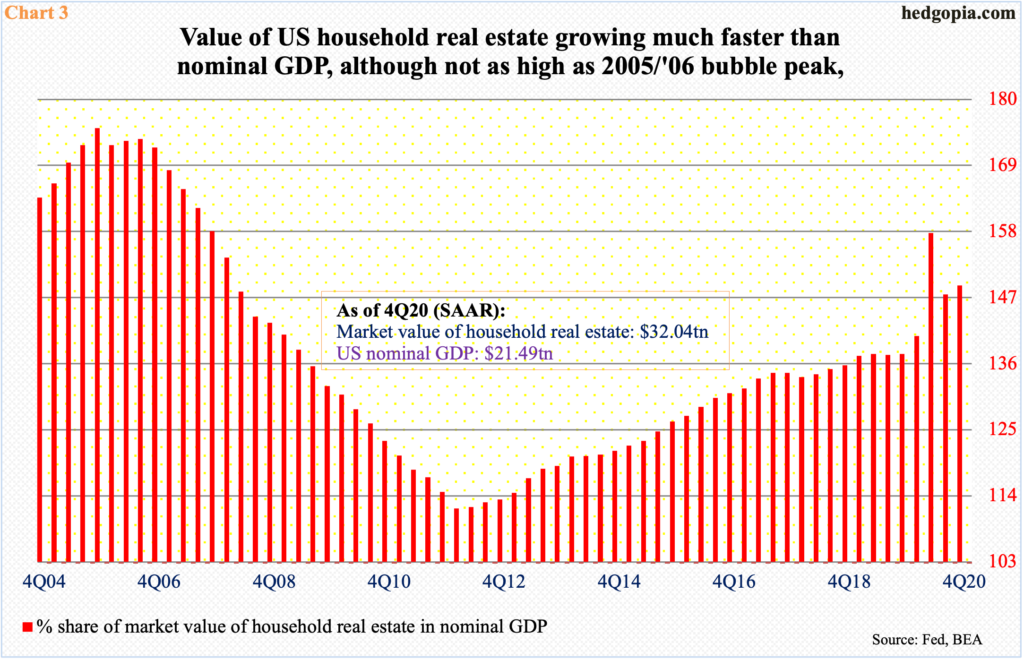
In 4Q20, the market value of US household real estate rose to $32 trillion, up $803.3 billion quarter-over-quarter. This metric has come a long way from the low of $17.9 trillion in 1Q12. The 4Q20 total made up 149.1 percent of nominal GDP. This is lower than the 157.7 percent reached in 2Q20, but that was mainly because of the sharp contraction in the economy, as nominal GDP shrank to $19.5 trillion, versus $21.5 trillion in 4Q20.
The overall trend has persisted higher since 2Q12 (Chart 3). Of note, the red bars were much higher in 2005 and 2006 as the bubble back then was getting ready to pop. This gives hope for housing optimists that the metric has room to run before it falls under its own weight.
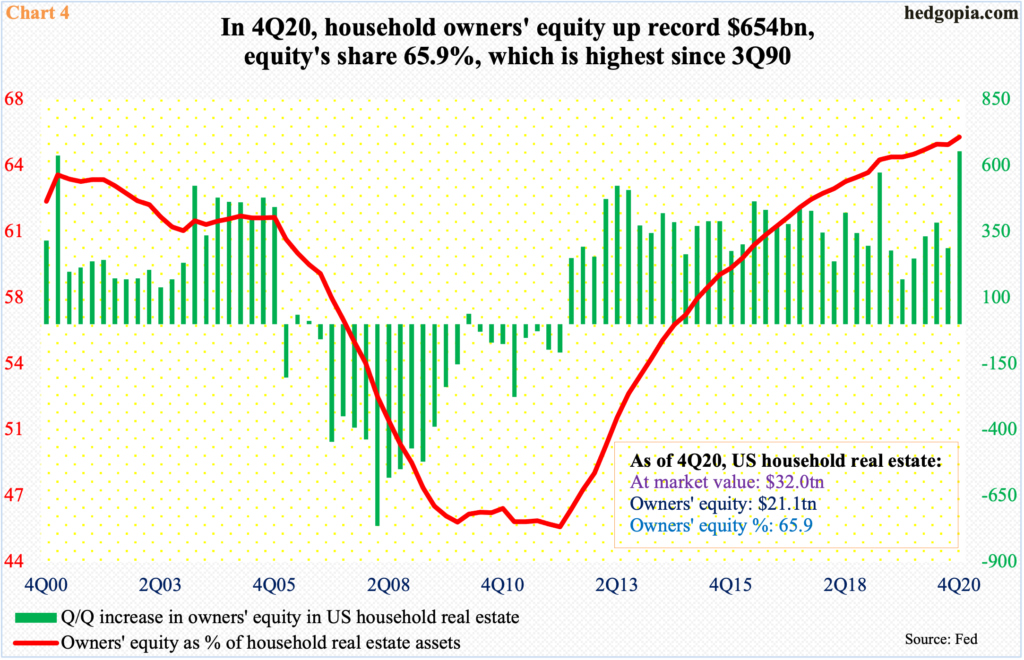
The rise in market value of real estate has led to a rise in owners’ equity. From 45.8 percent in 1Q12 to 65.9 percent in 4Q20, the red line in Chart 4 has persisted higher. The 4Q20 total is the highest since 3Q90.
On an absolute basis, owners’ equity was $21.1 trillion in 4Q20 – a new record and up $654.4 billion q/q. That is a lot of equity built up in just one quarter. This can help the economy, as home equity loans allow homeowners to borrow against the equity in their home. This is what the Fed intended.
This at the same time can also prove to be a mirage once home prices begin to go the other way, as we saw it happen after the last housing bubble burst. It is too hard to say if we are at that point yet. As seen earlier, metrics are elevated but off the bubble highs. So, what is crazy can always get crazier. But this at the same time is not a time to get too sanguine about what is transpiring in US housing – particularly on the price front. The sector is as susceptible as any to the rules of gravity.
Thanks for reading!


