
September Ends Badly… Is A Crash About To Hit?
Stocks ended the month with an extremely ugly candle.
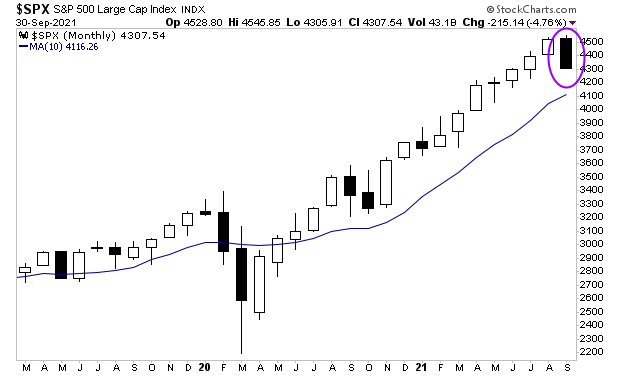
As the below chart shows, September ended outside the range of August (purple circle in the chart below). Historically, these developments usually resolve with the stock market testing its 10-month moving average (MMA).
As I write this Friday that line is at 4,116, however, we can expect it to rise to 4,1150 or so in the coming weeks. So, we’re talking about stocks dropping another 5% from here, which would bring the total correction to 10% or so.
The bigger question is if stocks will stop there.
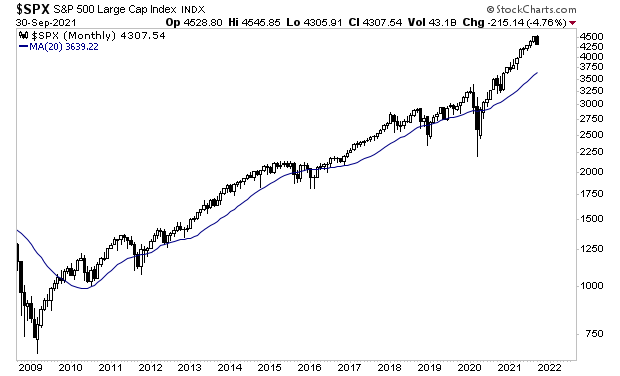
Despite the recent drop, stocks are still extremely stretched above their 20-MMA (some 13% to be precise). Historically any time the market has been this stretched, we’ve seen a drop to the blue line.
This has many investors wondering if a crash is about to hit.
For more market insights and investment ideas, swing by our FREE daily e-letter at www.gainspainscapital.com.


