
Sentiment At Some Prior Equity Market Peaks
Not long ago I was asked to compare current sentiment data provided by the American Association of Individual Investors with the market sentiment levels reached near the peak of the technology bubble. Going a little further, below is a chart showing the individual investor Bull/Bear Spread near or going into the peak of the technology bubble and the peak reached just prior to the financial crisis.
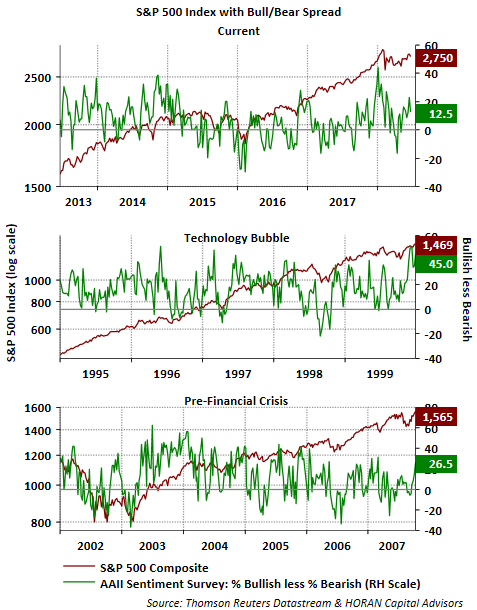
As the above chart shows, the bull/bear spread pre-technology bubble was a wide 45 percentage points. In the lead up to the financial crisis, the bull/bear spread equaled 26.5 percentage points. In this week's report from AAII, the bull/bear spread is only 12.5 percentage points.
The sentiment data is a contrarian measure and is most actionable at its extremes. Clearly, as the next chart below shows the current bullishness level of 38.7% is far from an extreme level, in fact, the current bullishness level equals the long run average reading for this measure.
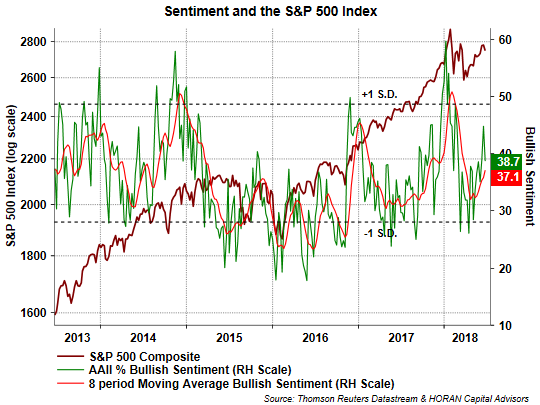
During the technology bubble, when the bull/bear spread was at 45%, the bullishness level was a high 75%. Going back to 1987, this is the highest bullishness reading reported by AAII. Pre-financial crisis, the bullishness level in October of 2007 reached 55%. So currently, from a sentiment perspective, individual investors are at least indicating they are not overly bullish. Looking at sentiment in a vacuum then would indicate the market is not at a top. Of course, time will provide the answer, but investors do not seem overly exuberant.
Disclosure: None.


