
Sensitivity At Market Highs: Weekly Nifty 9
Research Report Excerpt #1
Which sector will lead the longer-term trend? Sector and style rotation has remained a dominant theme in 2021, but investors shouldn’t get too bogged down by this debate, missing the forest for the trees. It’s this constant style and sector rotation, this leadership, and laggard-ship that may be making it that much more difficult to evoke a greater correction/consolidation period. The fact remains that a rising tide is lifting all boats longer-term. I think the best way to visualize this is in the following 35-day chart of sector performance.
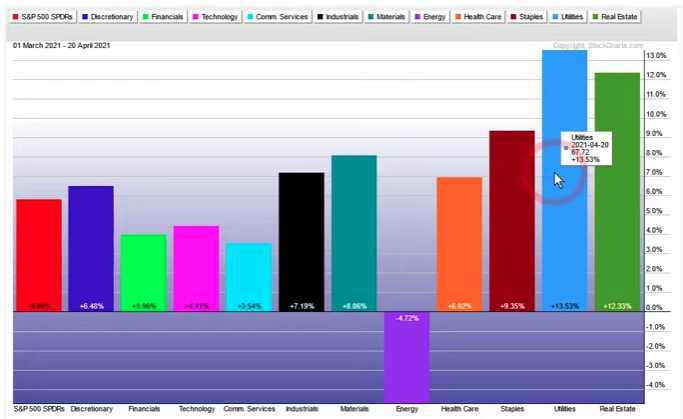
We’ve definitely seen a shift since late February/March in sector performance. What had been working was the reopening trade/cyclicals/value, but what has taken over leadership since has been defensive and that which was lagging, Staples, Utilities, Health Care and Real Estate. Nonetheless, most everything still delivered positive returns over this time period, shy of Energy. The main point is to pick good stocks, recognize that sector rotations are likely to continue, but know that if the fundamentals of the stock are strong while the stock’s sector is underperforming, eventually the laggards will come back to life in a bull market.
Research Report Excerpt #2
There are some key seasonal and analogue-type collisions occurring into May that investors should heed. The consideration, in my opinion, is one that fashions GAME PLANNING. Let’s first look at our trusted (to-date) 2009/2010 – 2020/2021 S&P 500 analogue.
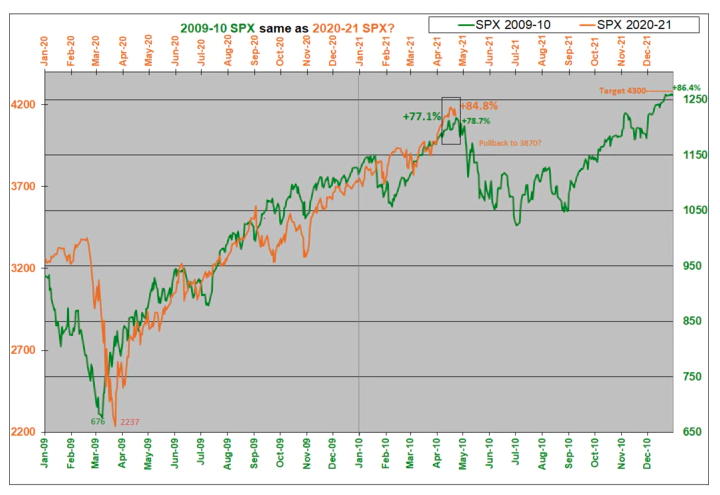
At the end of this past trading week, the S&P 500 was ~9% above where it is indicated in 2010. In the coming weeks, the S&P 500 embarked upon the initial leg of its major price consolidation, which was set off by the May 6th Flash Crash in 2010. While mechanisms were put into place post the 2010 Flash Crash to avoid such an occurrence in the future, it’s still incumbent upon investors to recognize current valuations and price will likely prove very sensitive going forward and through the analogue’s offered corrective period. I think this sentiment was proven this past week on Thursday, and when the Biden tax proposal plans were leaked out by the media.
Research Report Excerpt #3
What I’ve learned over my 22 years of investing and trading is that if I position for short-term potential, but with long-term fundamental/technical strength, I’m doing so with a win-win mindset. I may be positioning with a desire to achieve a near-term profit, but if it should prove disappointing, the long-term fundamentals/technicals offer an opportunity to increase my exposure to the trade, and benefit longer-term by an even greater profit. It’s a win-win. I tend to look at the market through that lens and using both disciplines.
Over the last year, the S&P 500 has spent nearly 90% of trading days above its 200-DMA, the longer-term moving average. That streak isn’t especially long relative to history, but what is notable is how long it has been since there has been a 1-year period where the S&P 500 was below its 200-DMA more than half of the time… more than half the time… more than half the time!
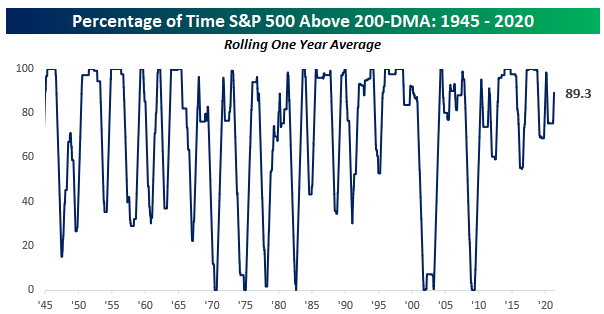
The reason for the repeating of “more than half the time” above is to solidify and define investor behaviors related to “buying the dip”. This longer-term perspective of how the market performed/s belies the 2009 – 2020 bull market, and if history is any guide, should continue with the newer bull market that began in mid-2020.
Research Report Excerpt #4
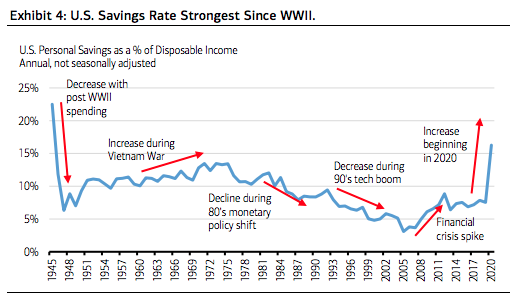
Fiscal stimulus checks, improving jobs recovery and lack of avenues to spend have left many consumers flush with cash and excess savings not seen since the 1940s. This lays the foundation for consumer spending that is reminiscent of the end of World War II. Just as consumer spending came to a standstill in the early months of the coronavirus, spending halted in the 1940s when wartime rationing was enforced, and saving for a brighter future was encouraged by the U.S. government. This led to a savings rate of 23% in 1945, up from 4% in 1930 (Chart below). The end of the war unleashed tremendous spending across both the goods and services industries. Factories responded by shifting from wartime production to meeting this new consumer demand, beginning with the automobile industry. New car sales quadrupled between 1945 and 1955,5 while GDP levels recovered from $226 billion in 1945 to $534 billion in 1960.6 If similarities hold, we should see a continued U.S. expansion as pent-up consumer demand is released into the economy upon further reopening this year.
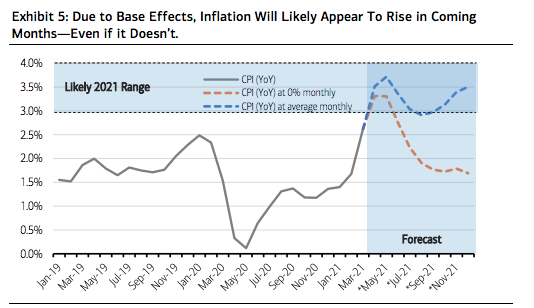
As the economy rapidly accelerates out of the coronavirus-induced recession, some lingering effects need to be understood. An important one is the near-term trajectory of inflation. The depths of the crisis saw 3 months of deflation as measured by monthly changes in the Consumer Price Index (CPI). March, April, and May of 2020 saw price declines of -0.3%, -0.7%, and -0.1%, respectively. Three consecutive deflationary readings is unusual, happening only 3 other times in the past 7 decades (Global Financial Crisis, Tech bubble, and Saving & Loan Crisis). These low CPI readings lead to what economists term “base effects.” Since the base on which CPI is measured was so low one year ago, future YoY CPI readings will be relatively high. In fact, even with no inflation at all, exceedingly unlikely, YoY CPI will likely register above 3% in both April and May! If inflation simply averages the same monthly rate it has since 2019, still a conservative estimate, CPI should be in the 3% to 4% range for 2021 in our view, averaging 3.3% on the whole of the year. (Merrill Lynch)
In the coming week, investors will once again obtain the latest Fed rate announcement and do battle with the post-announcement/statement press conference. Economists are likely to focus their questions toward the Fed Chairman, concerning inflation and the Fed’s dual mandate, which includes price stability/inflation. Keep in mind, the Fed is attuned to and expects these higher readings noted above and with respect to inflation. Furthermore, their preferred inflation measure, PCE due out this coming week, is not nearly as distorted by base effects. Both the Fed and markets should “see-through” this likely apparent increase in inflation. Investors, therefore, should be aware of these potentially artificially high readings near term, and not be unduly influenced by them if the market has an adverse reaction to them. On the flip side, however, because they are so expected, a persistent increase in inflation may actually potentially be misdiagnosed as transitory, leading to an eventual tightening of monetary policy sooner-than-expected. The actual path for inflation will therefore be an active and important debate for the coming years.
Research Report Excerpt #5
The blended earnings growth rate for the first quarter is 33.8% today, compared to an earnings growth rate of 30.3% last week and an earnings growth rate of 23.8% at the end of the first quarter (March 31).
Insight/2021/04.2021/04.23.2021_EI/S%26P%20500%20Earnings%20Growth%20Q1%202021.png?width=920&name=S%26P%20500%20Earnings%20Growth%20Q1%202021.png)
If 33.8% is the actual growth rate for the quarter, it will mark the highest year-over-year earnings growth reported by the index since Q3 2010 (34.0%), according to FactSet data. Looking at future quarters, analysts project double-digit earnings growth for the remaining three quarters of 2021, with earnings growth expected to peak in Q2 2021 at 55.4 percent.
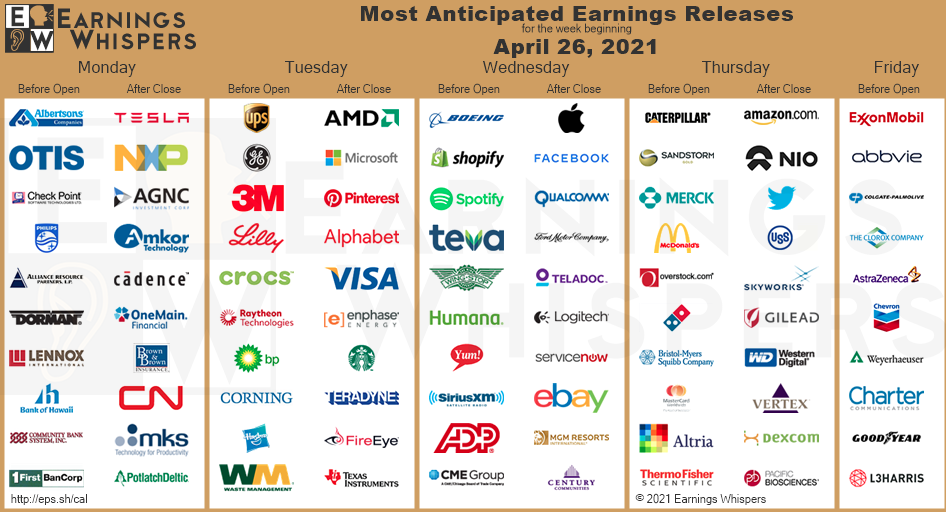
During the upcoming week, 181 S&P 500 companies (including 10 Dow 30 components) are scheduled to report results for the first quarter.
Research Report Excerpt #6
“Quiet periods are the perfect time to strengthen your mental game. A lot of investing is about controlling your emotions and biases, believe it or not. And let’s face it: Hubris seems to be at an all-time high these days, along with prices in most markets.
This week, we’ll look at the Dunning-Kruger Effect and how an imbalance of competency to confidence could sabotage your investing success.”
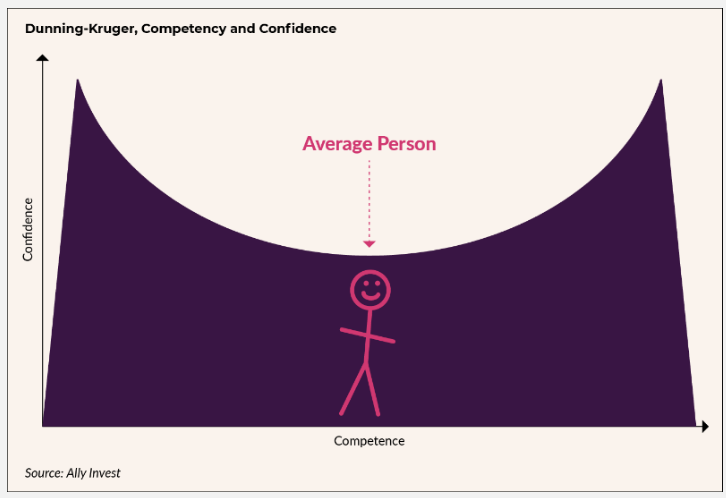
The Dunning-Kruger Effect is a cognitive bias in which people overestimate their competency and underestimate other catalysts, such as luck, for an outcome.
There’s a relationship between competency and confidence, too. A little knowledge can lead to a lot of confidence until you realize how much you don’t know about a certain subject.
Research Report Excerpt #7
The course over the last 13 months has been upward sloping, with the S&P 500 growing over 85% from the March 2020 lows. Good, bad… what does the data suggest?
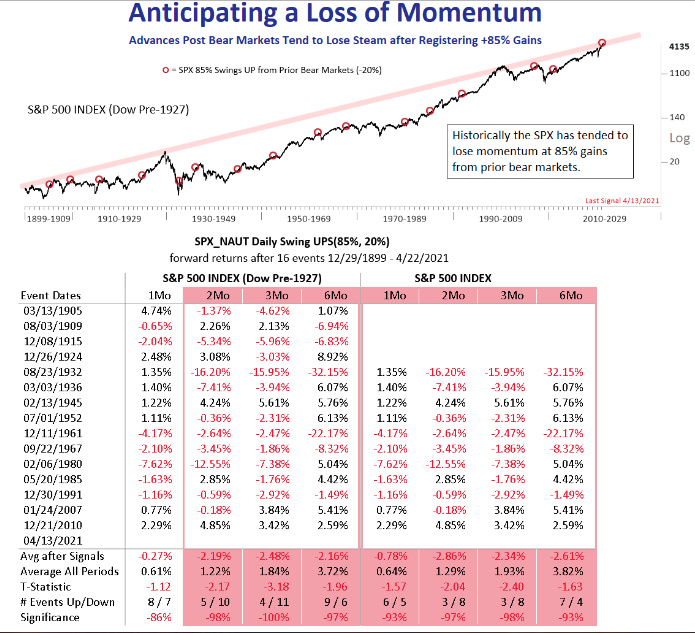
The 85% runs higher after prior bear markets (declines of at least -20%) don’t generally favor the bulls. Looking at some of the dates noted, however, none register the breadth readings we’ve outlined in this week’s or past Research Reports.
Research Report Excerpt #8
The initial market reaction was to sell equities given that the proposal was to raise capital gains taxes. This was your opportunity as an investor, as detailed in Finom group’s latest State of the Market video.
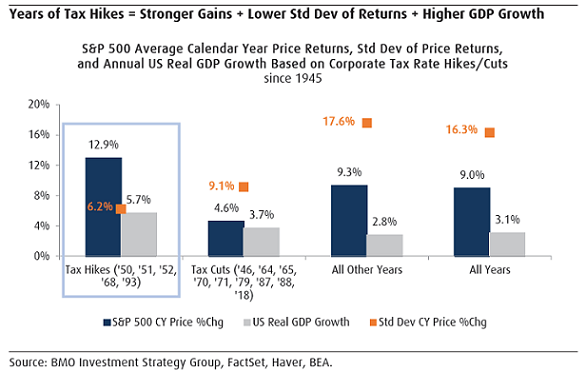
The below chart from BMO Investment Strategy Group shows the performance of the S&P 500 Index during periods taxes were either raised or lowered since 1945. In the years of tax increases, the S&P 500 Index generated better returns versus years in which tax cuts were instituted. Additionally, GDP growth was stronger in the years where tax hikes were instituted as well.
Research Report Excerpt #9
Something I remind myself of often is that my mistakes or misgivings as a strategist, investor, and analyst are no greater than anybody elses mistakes. As we often look to breadth to validate price action, an example of this sentiment I offer takes us back to April 2020.
“Sharp declines in market breadth in the past have often signaled large market drawdowns,”Goldman Sach’s David Kostin wrote. “Narrow breadth can last for extended periods, but past episodes have signaled below-average market returns and eventual momentum reversals.”
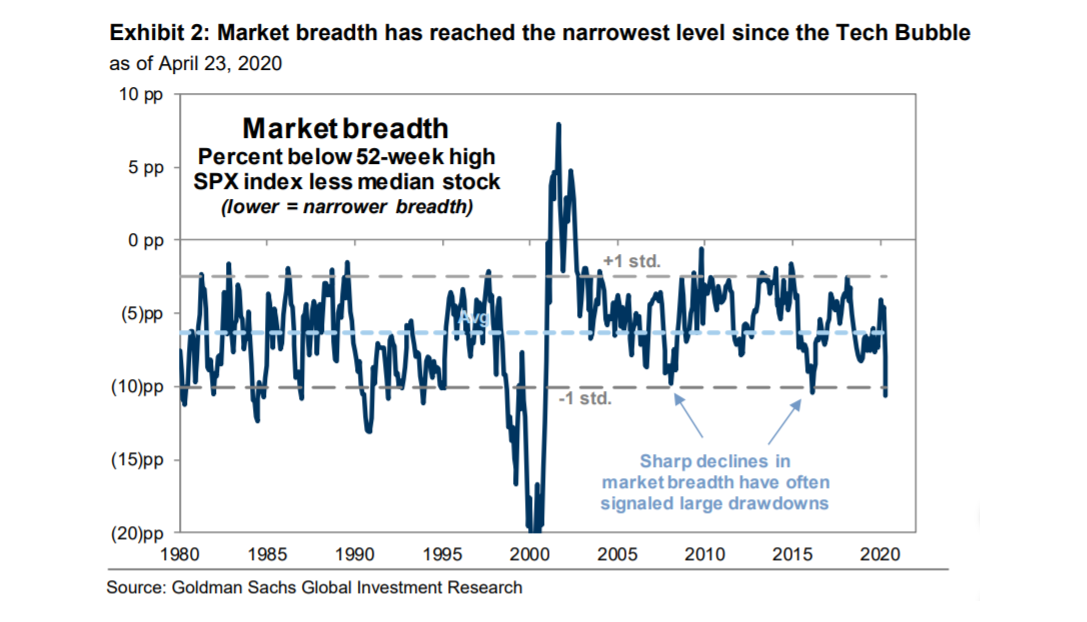
An example of history not repeating, maybe? An analyst not recognizing that major market troughs demand leadership before investors become more confident and breadth broadens? Whatever the case may be, imperfect markets and becoming prisoner of any singular moment is a natural occurrence, even for seasoned pros.
Disclaimer: The risk of loss in stock, stock/options, futures, futures/options, and forex trading is substantial, and site visitors and subscribers should consider whether trading these markets ...
more

