
Semiconductors About To Send Strong Bullish Message To Stocks?
(Click on image to enlarge)
Sir John Templeton used to say that the four most dangerous words in investing are; “It’s Different This Time.”
Investors might want to keep a close eye on this ratio to see if the results will be different this time!
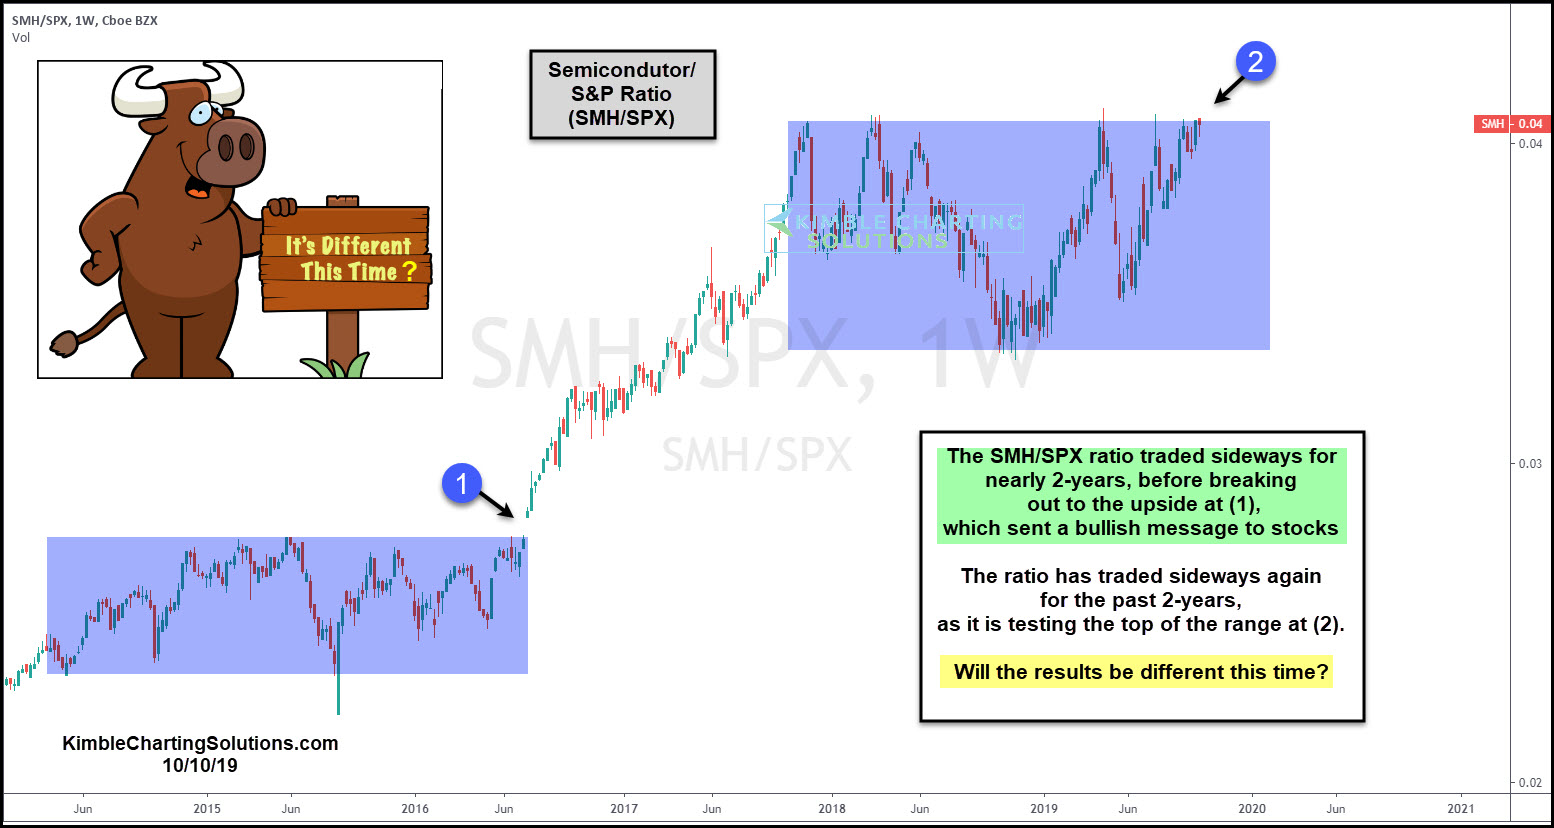
This chart looks at the Semiconductor/S&P 500 ratio (SMH/SPX) over the past 5-years.
The ratio traded sideways for nearly two years (2014-2016) before breaking out at (1). When the ratio broke out in 2016, the S&P 500 soon experienced a strong rally.
Turning the page to current conditions, the ratio has traded sideways again for nearly the past two years as it tests the top of the range at (2).
Stock bulls would love to see a breakout at (2). Bulls would receive negative news if the ratio happens to peak again at the top of this range.
If the ratio would succeed in breaking above the top of the range/resistance, will the results be different this time?
What this ratio does from now till year-end, should send an important message to the broad markets.
Disclosure: Sign up for Chris's Kimble Charting Solutions' email alerts--click here.


