
Secular Trends In Employment: Goods Producing Versus Services Providing - Monday, March 11
The Department of Labor has monthly data on employment by industry categories reaching back to 1939. At the highest level, all jobs are categorized in either Service-Providing Industries or Goods Producing Industries. The adjacent chart illustrates the ratio of the two since 1939.

The latest monthly employment report showed a gain of 20K nonfarm payrolls, which consists of a gain of 52K service-providing jobs and a loss of 732K goods-producing jobs.
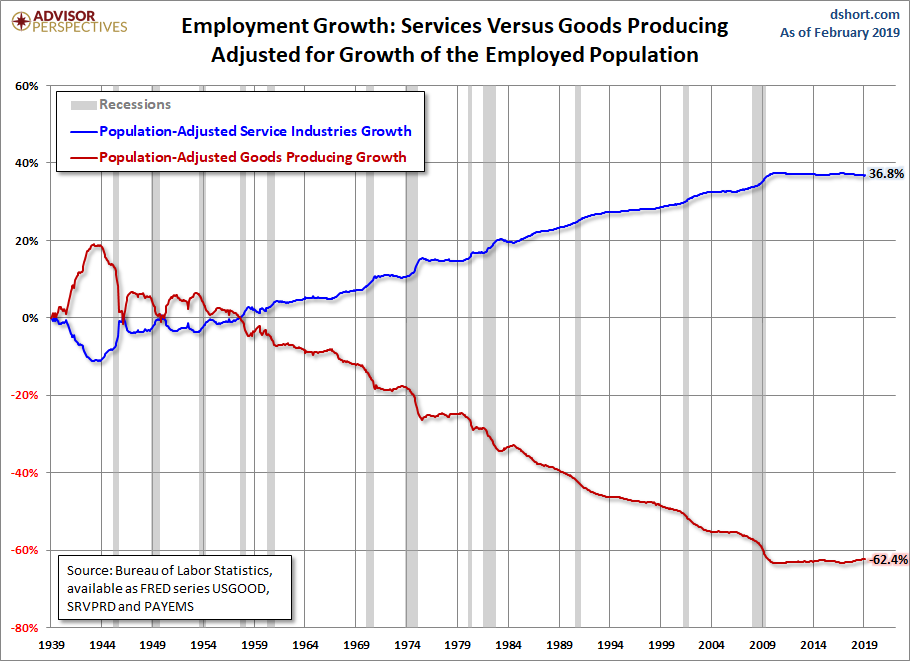
In 1939 service providing industries employed more people than goods-producing, 63.1% to 37.2%, a ratio of 1.7-to-1. World War II triggered a surge in goods-producing employment and an accompanying reduction in services. But following the war, we've seen a steady tilt toward services. The ratio is now 6.2 services jobs for every goods-producing job. The key drivers of this secular trend have been the growth of automation that reduces the need for human labor and the globalization of goods production.
The next chart provides a more detailed view of these two employment cohorts. We've adjusted for the 400 growth in the employed population since 1939. A conspicuous feature of this snapshot is the sharp trend reversal in the early 1940s reflecting the impact of World War II on the demand for goods. Another notable detail is the stable ratio since the last recession. We saw shorter periods of a sustained ratio during the stagflation of the 1970s and for about three years starting at the end of 2003. The current ratio of services to goods-producing has been essentially unchanged for over six years.
Another notable insight is the consistent impact of recessions on the relative growth of the two cohorts: Even though the unemployment rate increases during recessions, the employed service providing population increases and goods-producing jobs disappear. We also see that post-recession recoveries don't reverse this pattern.
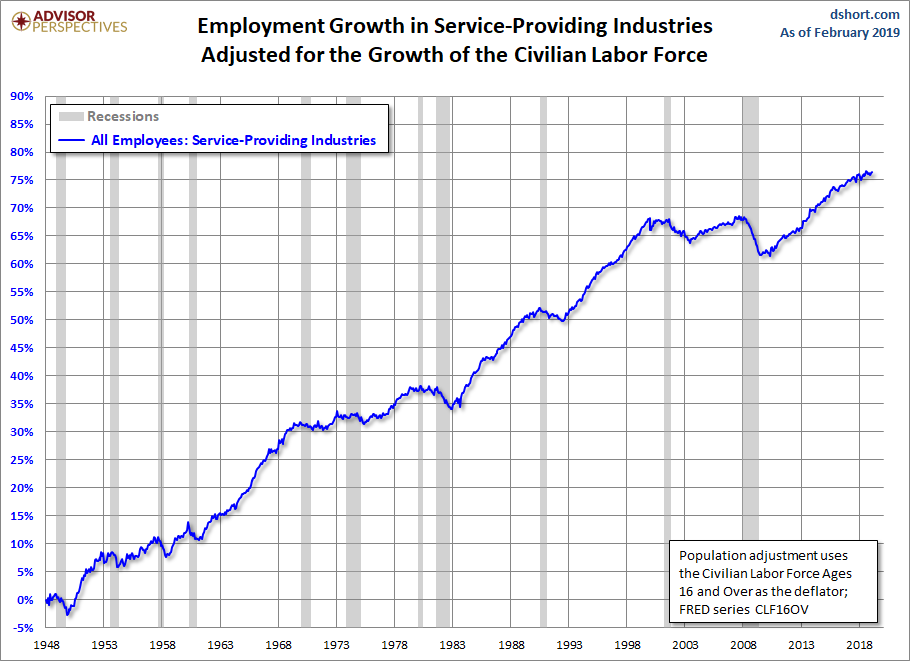
The chart above is adjusted for population inflation based on the growth of the employed population. The next chart focuses on the services providing employed adjusted with a broader population base, the civilian labor force age 16 and over, which includes both the employed and those seeking employment. A striking feature of this chart is its uncanny resemblance to the S&P Composite (the S&P 500 spliced with its predecessor, the S&P 90).
How close is the correlation with the S&P 500? Here is an overlay of the services-providing employed population (left axis) and the S&P 500 (log-scale right axis) since 1995.
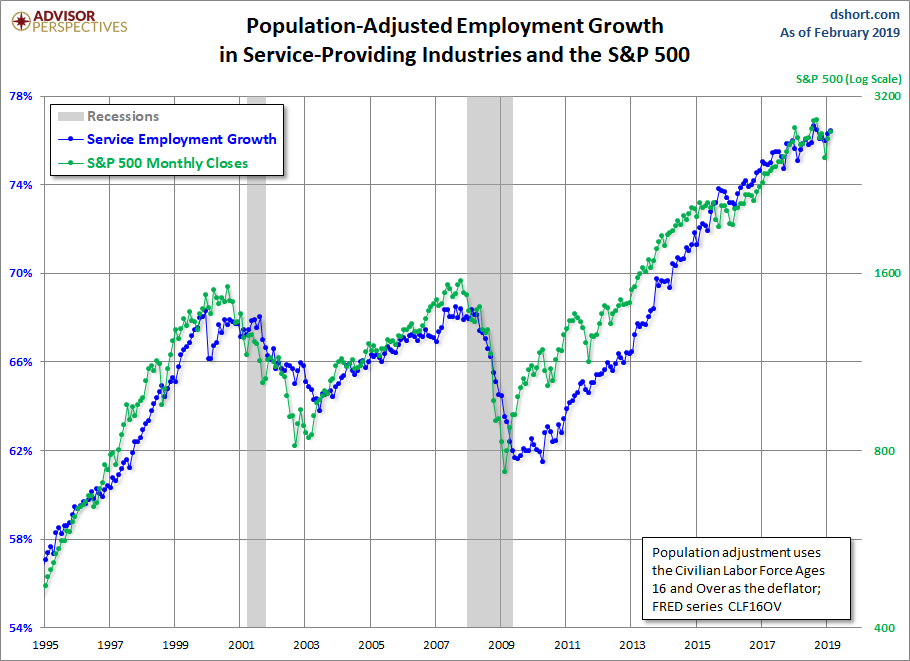
The index peaked in March 2000, although the monthly close peak was five months later in August 2000. Service employment didn't sharply decline until September of the following year. The index peaked again in October 2007 for both its daily and monthly close highs. Service employment began its nosedive eight months later in June of 2008.


