
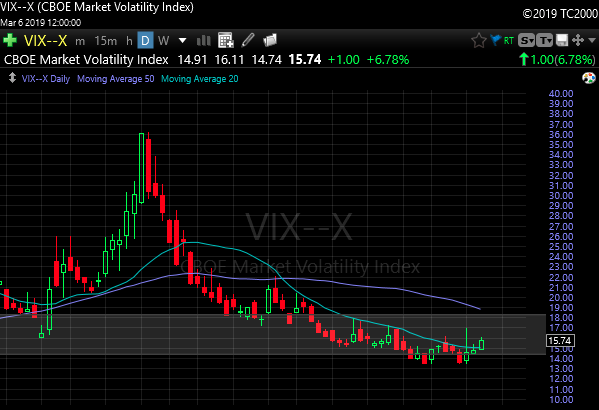
Sectors Teetering On Breaking Down, Volatility Elevating Ahead Of Nonfarm Payroll Data
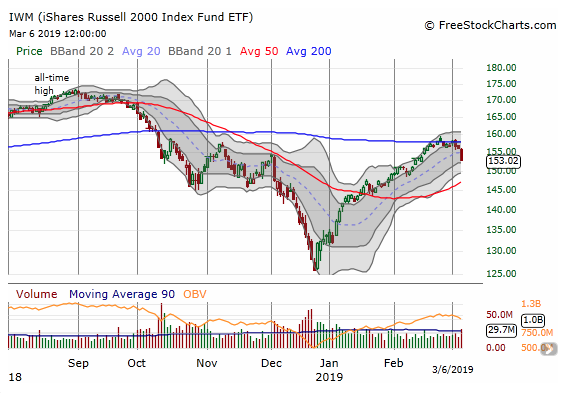
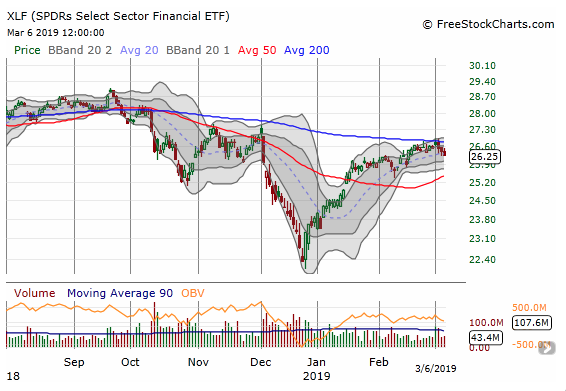
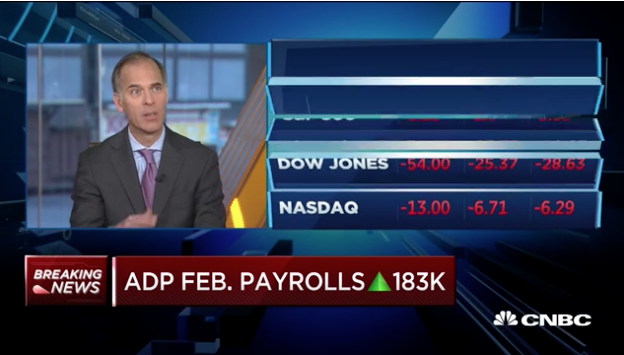
Wall Street is in the midst of shedding some of its overbought conditions that have persisted in the prior two weeks. The major averages have been lower for the totality of the trading week leading up to Thursday. Small Cap stocks expressed the largest decline on Wednesday and post the release of the ADP private payroll data. The Russell 2000 Index fell 2% followed by the Nasdaq (NDX) that fell nearly 1% on the day. The Dow Jones Industrial Average (DJIA) and S&P 500 (SPX) fell a little more than .50% on the day. The selling pressure seems set to resume with equity futures lower ahead of the opening bell Thursday.
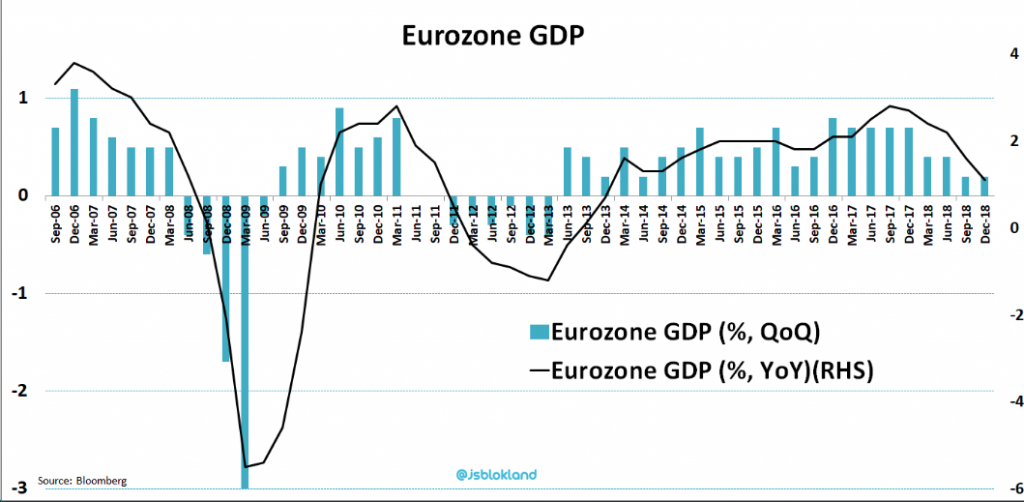
The U.S. equity future weakness mirrors the weakness in European indices and comes ahead of the European Central Bank Meeting this morning. Additionally, headlines surrounding Eurozone economic growth for Q4 2018 are breaking. The Eurozone economy grew 0.2% in the final quarter of 2018. Year-over-year growth has fallen to 1.1%, the slowest pace in five years.
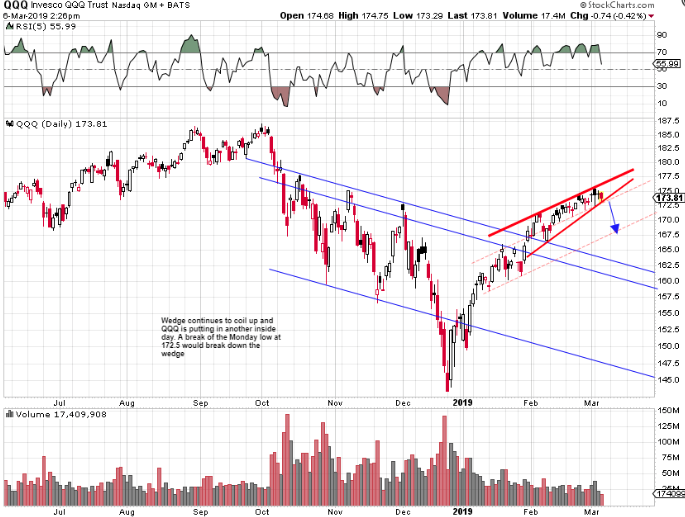
“The tightening price action combined with declining volume is an attractive setup for a drop to 167 - trigger would be a break of 172.5.”
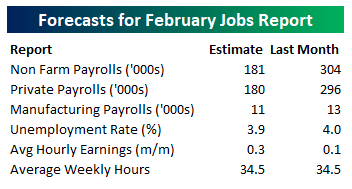
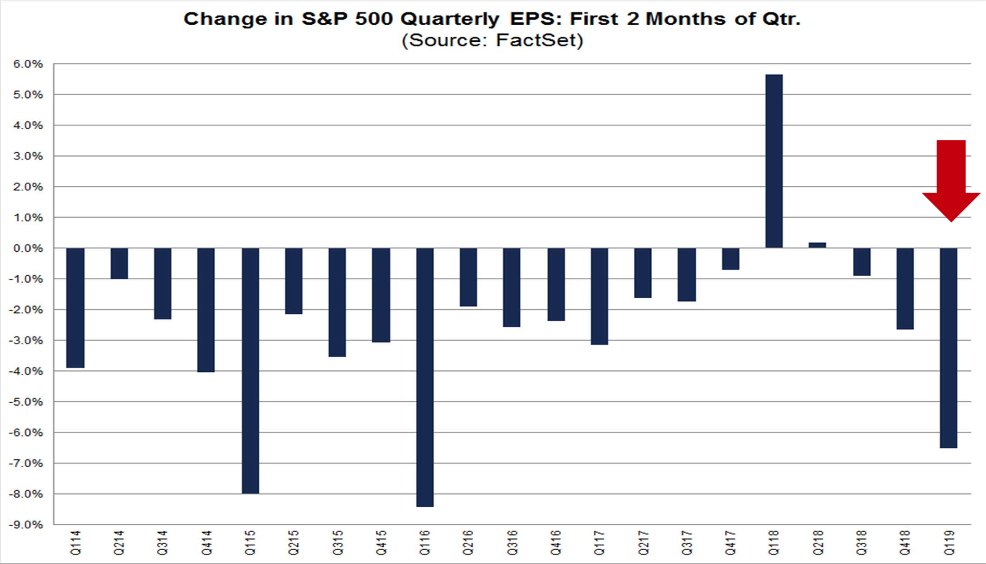
Speaking of economic data, heading into Friday’s Non-Farm Payrolls (NFP) report for February, economists are expecting an increase in payrolls of 181K, which would be a decline from January’s monster report which came in above expectations at 304K. Below is a table from Bespoke Investment Group that offers both the previous NFP results and the estimates for this Friday’s release.
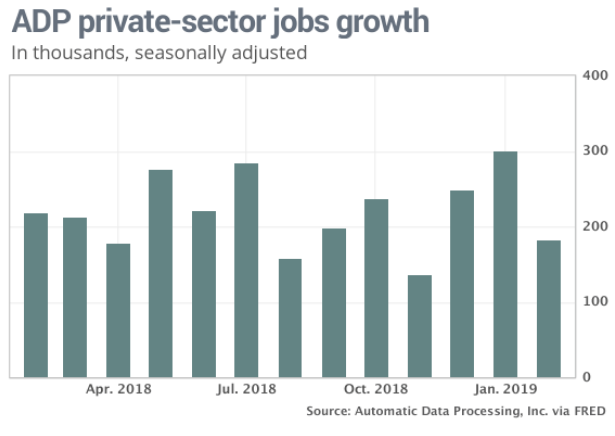
“Job gains are still strong, but they have likely seen their high-water mark for this expansion,” said Mark Zandi, chief economist at Moody’s Analytics, in a statement. In an interview on CNBC, Zandi said he now sees gross domestic product running at a 0.3% annual rate in the first quarter, much slower than the 2.6% rate reported for the final three months of last year. This slowdown “will start to show in payroll data.
The economy has throttled back, and so too has job growth,” Mark Zandi, chief economist at Moody’s Analytics, said in a statement. “Job gains are still strong, but they have likely seen their high watermark for this expansion.”
The partial government shutdown led to slower activity in about six Fed districts. The impact hit a wide range of sectors, including retail, auto sales, tourism, real estate, restaurants, manufacturing, and staffing services. Consumer spending was “mixed” and several districts said retail and auto sales were lower due to harsh winter weather and higher costs of credit.
Manufacturing activity strengthened but firms conveyed a wall of worry about weakening global demand, higher costs due to tariffs, and ongoing trade policy uncertainty.
With the Fed’s Beige Book released, Fed speakers carried forward with their individual speeches and messaging on Wednesday. In a speech to the Economic Club of New York, New York Fed President John Williams said the economy is currently “about as good as it gets: very low unemployment, sustainable growth and inflation just about at our 2% goal.”
“Given this favorable situation, when you look at monetary policy, things are looking pretty normal as well,” said Williams, who is the only regional president that gets a vote at all Federal Open Market Committee meetings. My current estimate for r-star is 0.5%, so when you adjust for inflation that’s near 2%, the current federal funds rate of 2.4% puts us right at neutral.”
“I’ve said it before and no doubt, I’ll say it as long as I work for a central bank. But in the current conditions the phrase takes on even more importance. Our response will always be ‘data dependent. We can afford to be flexible and wait for the data to guide our approach.”
The punch line for a potential “Ides of March” moment is this: if we see the seasonal post-serial options expiration / quad-witch rally-then-pullback phenomenon occur (as has been the median outcome over the past 25 years), which this year could look even more exaggerated on account of the extreme $Delta / $Gamma currently seen in SPX / SPY / QQQ (Consolidated SPX / SPY $Delta is currently 96th %ile and crowded “Growth” proxy QQQ $Delta is currently 97th %ile while $Gamma is 89th %ile), it would then converge with the “demand vacuum” of the onset of the “corporate blackout” window (75% into blackout by 3/19/19) at the same time alongside a mechanically-driver “higher sell pivot” levels in the 1Y CTA model for both SPX and NDX which could potentially dictate outright SELL flows—thus, we could have the makings of a “March Surprise.”
The specific SPX seasonal pattern over the past 25 years surrounding the March serial options expiration, or the “trade up” into, “trade down” out of pattern
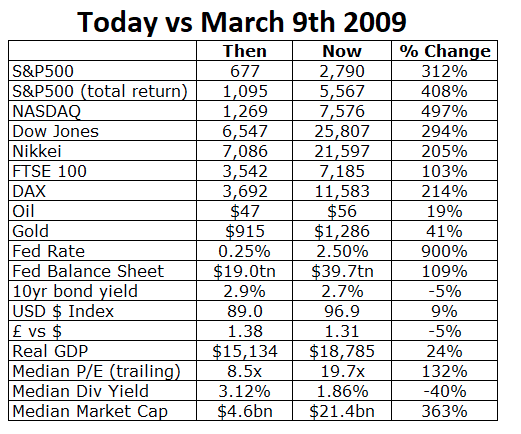
It's been exactly a decade since the low set on Mar 6, 2009. Let's look at what's changed since then! We can recall when QE first began it was assumed to create inflation in the economy. With that said, check out the “then and now” with regards to the 10-year Treasury Yield.
Stay tuned for our latest State of the Markets (SOTM). Our subscribers will be able to review the video this evening and our visitors will be able to review it tomorrow morning. In addition to ...
more

