
Sector Mean Reversion
With the S&P 500 seeing another decline yesterday, the index finished the day roughly 1.9% below its 50-DMA. As shown in the charts from our Sector Snapshot below, that is the furthest below its 50-DMA since April 21st; about one month after the bear market low. As for the eleven major sectors, the majority are likewise below their moving averages. The worst of these is Energy which finished the day yesterday 10.7% below. The second worst sector, Real Estate, is much closer to its 50-DMA at only 3.59% below its 50-DMA. On the other hand, Industrials and Materials are the only sectors above their 50-DMAs at 0.76% and 1.05%, respectively. That is not to say they are not trending in the same direction as the other sectors, though. As shown below, even though they are currently above, these two sectors are seeing falling 50-DMA spreads just like every other sector.
(Click on image to enlarge)

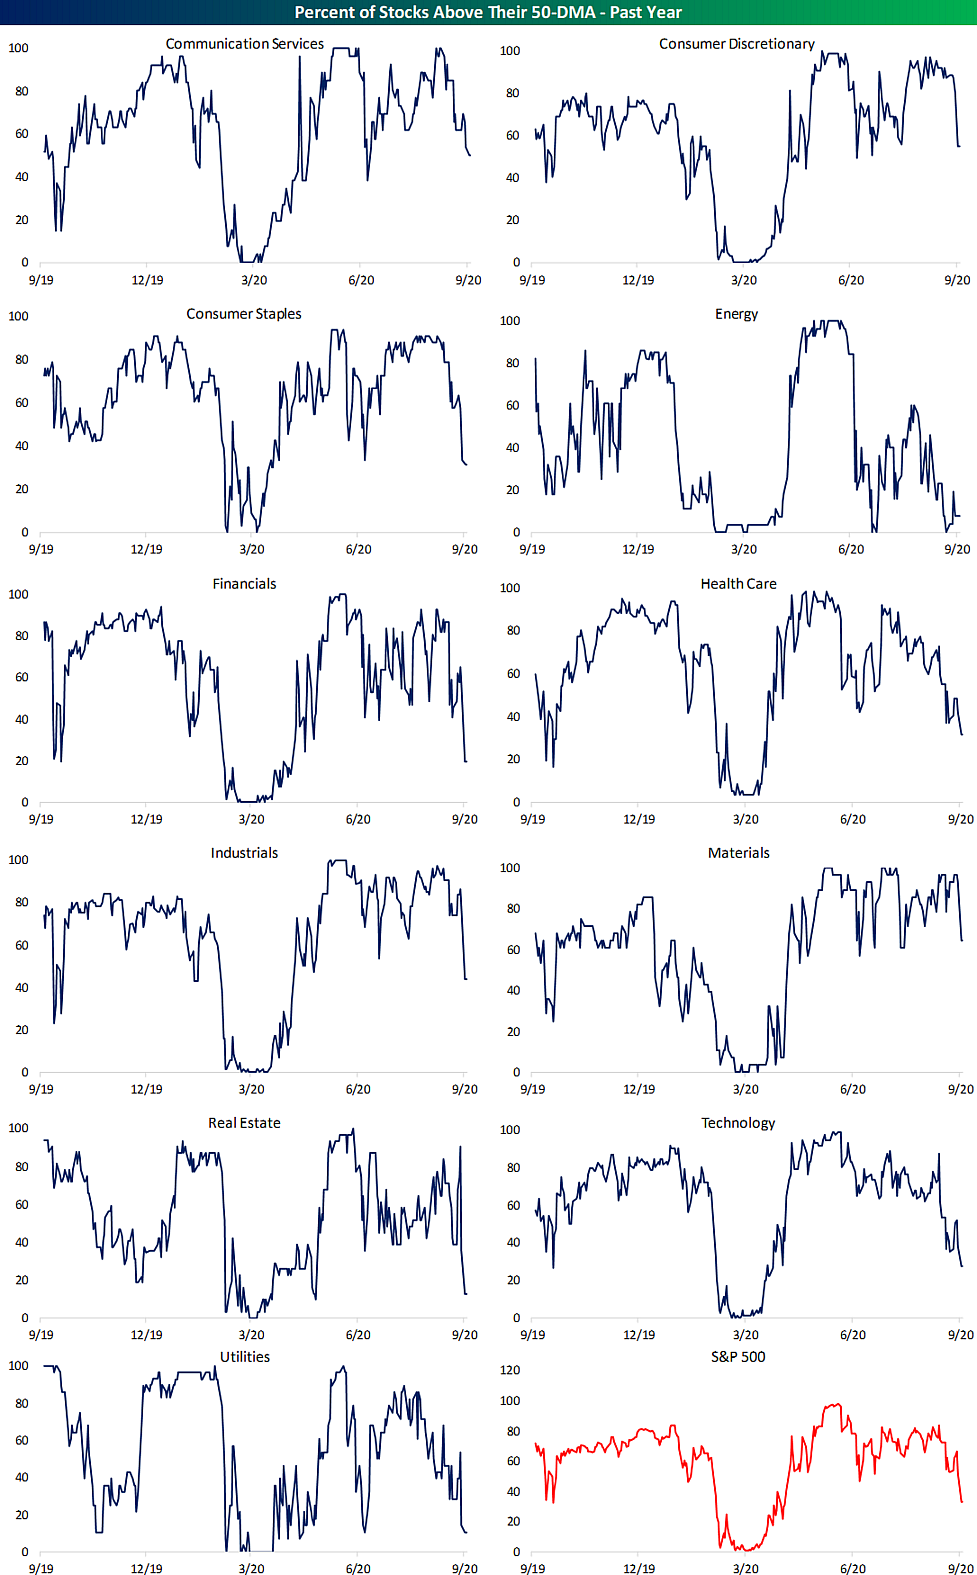
A higher number of individual stocks in each sector are also falling below their 50-DMAs.Yesterday’s session marked a bit of a tipping point for the percentage of stocks trading above their 50-DMAs. We finished last week with 52.48% of S&P 500 stocks trading above their 50-DMAs, but at yesterday’s close, only 33.27% were above. Other than yesterday, since the second half of April there was only one other day (June 26th) that less than half of S&P 500 stocks closed above their 50-DMAs. Similarly, the 19.21 percentage point drop in the percentage of stocks above their 50-DMAs for the S&P 500 was the largest single-day decline since June 24th (20.04 percentage points). Prior to that you would have to go back to the start of the COVID bear market, February 24th, to find another day with a bigger single-day drop in this reading.
Looking across the sectors, Energy, Utilities, and Real Estate have the fewest stocks above their 50-DMAs. Meanwhile, Communication Services, Consumer Discretionary, and Materials all still have at least 50% of stocks above. Materials boasts the strongest reading at 64.29%.
(Click on image to enlarge)
Disclaimer: To begin receiving both our technical and fundamental analysis of the natural gas market on a daily basis, and view our various models breaking down weather by natural gas demand ...
more

