
Sector Detector: Utilities Plow Ahead While Market Takes An Overdue Breather
The weakness last week in U.S. stocks was entirely expected. As I mentioned in last weekend’s article, the technical condition had become quite overbought and the market was overdue to take a breather and pull back a bit. Also, our SectorCast rankings had moved from bullish to a more neutral bias. And then of course, there was uncertainty created by the most serious confrontation between Russia and the West since the Cold War -- the looming referendum in Crimea to become independent from Ukraine and strengthen ties with Russia. Thus, stocks closed Friday with their biggest weekly drop in the last seven weeks.
Among the ten U.S. business sectors, the only sector that was up last week was Utilities (up about +2.4%), and other defensive sectors like Consumer Staples and Telecom were down only nominally. Also, Utilities have supplanted Healthcare as the leading sector year-to-date, up over +7%.
The CBOE Market Volatility Index (VIX), a.k.a. “fear gauge,” surged from 14.11 the prior Friday -- when the market set a new high -- to 17.82 last Friday. This is just another indication of investor trepidation ahead of the Crimean referendum.
To a lesser extent, the Federal Reserve is also on investors’ radar for this week as its FOMC meeting commences on Tuesday -- the first with Janet Yellen as chairperson. The consensus view is that an additional $10 billion taper is a foregone conclusion at this meeting, and only a major economic threat would disrupt the planned tapering program.
Corporate earnings season is wrapping up, and quarterly earnings for the S&P 500 companies is up more than 9% versus the same quarter last year, with more than 60% of the firms beating expectations. There has been a pronounced weather effect on economic growth, but it has mainly impacted supply rather than demand, so we should see acceleration in growth as weather allows supply to catch up in coming quarters.
Not surprisingly, Crimea voted overwhelmingly on Sunday to secede from Ukraine and join Russia, although there is no provision for such a referendum in the Ukrainian constitution. It’s pretty crazy to consider that it was Khrushchev who arbitrarily gave Crimea to Ukraine 60 years ago, and now Putin wants to arbitrarily take it back. It seems that constitutions are just pieces of paper with little meaning in the big scheme of things. When times get difficult, people tend to prioritize bloodlines over borders.
Now, all eyes will be watching for the resulting fallout. This Crimean “brick” adds to ongoing concerns about growth in China and Fed tapering, among other issues of the day, in the market’s “wall of worry.” But bulls typically enjoy climbing the wall. I suspect this situation will be no different.
SPY chart review:
The SPDR S&P 500 Trust (SPY) closed Friday at 188.26, which is down 2% from the prior Friday’s close at a new high. As I said last week, the market was likely to lose its steam and pull back. The top of the rising channel indeed proved to be tough resistance and the oscillators were all extremely overbought such that the market desperately needed a breather to “reload.” There was also the bearish hanging man formation on the prior Friday and a gap up from March 4 that was acting like a magnet to be filled. Too many short-term bearish indicators were lining up. A healthy market will always take some time to fill gaps and test prior-resistance-turned-support levels, which serves to reinforce bullish conviction, and this is what we are seeing. The 20-day simple moving average failed to offer firm support despite a valiant attempt on Thursday, but the 50-day should prove much stronger if it is tested.
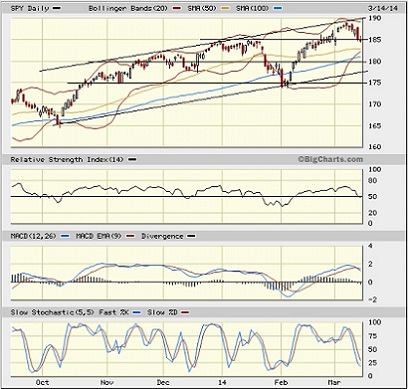
The oscillators are not yet in oversold territory, so there is definitely more downside potential in the charts. On the other hand, although price closed Friday below prior resistance-turned-support at 185, it hasn’t yet confirmed a breakdown, so it could bounce from here. But if SPY declines further, there are plenty of support levels to cushion the fall, starting with the 50-day SMA (near 183), the 100-day SMA (near 181), round-number support at 180, and the bottom of the rising channel (currently near 177).
Latest sector rankings:
Relative sector rankings are based on Sabrient’s proprietary SectorCast model, which builds a composite profile of each equity ETF based on bottom-up aggregate scoring of the constituent stocks. The “Outlook Score” employs a forward-looking, fundamentals-based multifactor algorithm considering forward valuation, historical and projected earnings growth, the dynamics of Wall Street analysts’ consensus earnings estimates and recent revisions (up or down), quality and sustainability of reported earnings (forensic accounting score), and various return ratios. It helps us predict relative performance over the next 1-3 months.
In addition, SectorCast computes Sabrient's Bull Score and Bear Score for each ETF based on recent price behavior of the constituent stocks on particularly strong and weak market days. High Bull score indicates that stocks within the ETF have tended recently toward relative outperformance when the market is strong, while a high Bear score indicates that stocks within the ETF have tended to hold up relatively well (“safe havens”) when the market is weak.
Outlook Score is forward-looking while Bull and Bear are backward-looking. As a group, these three scores can be helpful for positioning a portfolio for a given set of anticipated market conditions. Of course, each ETF holds a unique portfolio of stocks and position weights, so the sectors represented will score differently depending upon which set of ETFs is used. For Sector Detector, I use the iShares that represent the ten major U.S. business sectors: Financial, Technology, Industrial, Healthcare, Consumer Goods, Consumer Services, Energy, Basic Materials, Telecom, and Utilities. Whereas the Select Sector SPDRs only contain stocks from the S&P 500, I prefer the iShares for their larger universe and broader diversity. Fidelity also offers a group of sector ETFs with an even larger number of constituents in each.
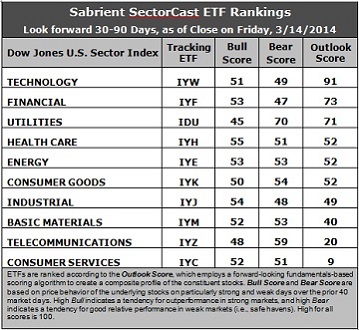
Here are some of my observations on this week’s scores:
1. Technology (IYW) retains the top spot with a strong Outlook score of 91. Anything above 90 is impressive and highly notable. Financial (IYF) has made a return to the second spot after being supplanted last week by defensive sector Utilities (IDU), but they are virtually neck-and-neck with scores of 73 and 71, respectively. Technology has consistently displayed solid factor scores across the board, with a strong forward long-term growth rate, a relatively low forward P/E, the highest return ratios, and good sentiment among Wall Street’s sell-side analysts (net positive revisions to forward earnings estimates) and company insiders (open market buying). Financial displays one of the lowest forward P/Es and decent sentiment among both sell-side analysts and company insiders. Utilities suffered a bit in its valuation (forward P/E) after its strong recent relative performance. After Utilities in the rankings comes Healthcare (IYH), Energy (IYE), and Consumer Goods (IYK).
2. Consumer Services (IYC) has fallen back into the cellar with an Outlook score of 9. It continues to boast the best forward long-term growth rate, but many of the retailers have been struggling and cutting estimates. The sector has a relatively high forward P/E and weak sentiment among both Wall Street analysts (net negative revisions to earnings estimates) and company insiders (low buying activity). Telecommunications (IYZ) is in the bottom two with a score of 20. It continues to score among the lowest on most of the factors in the model, including the highest forward P/E, lowest return ratios, and a low projected long-term growth rate. However, it has some improving Wall Street support.
3. Our fundamentals-based rankings moved to a neutral near-term bias last week, although this week’s rankings might indicate a slight slant to the bullish side of neutral. Tech and Financial remain strong, but the relatively high scores for defensive sectors like Utilities and Consumer Goods keeps up a caution flag.
4. Looking at the Bull scores, Healthcare has been the leader on strong market days, scoring 55, while Utilities is the laggard with a score of 45. The top-bottom spread is only 10 points, reflecting moderately high sector correlations on particularly strong market days. It is generally preferable in a healthy market to see the top-bottom spread approach 20 points.
5. Looking at the Bear scores, Utilities scores a 70, giving a clear indication that stocks within this sector are the preferred “safe havens” on recent weak market days. Also, Telecom scores a strong 59. Financial scores the lowest with a 47, followed by Industrial at 48. The top-bottom spread is a robust 23 points, reflecting low sector correlations on weak market days, which is a good sign for a healthy market.
6. Overall, Technology easily displays the best all-weather combination of Outlook/Bull/Bear scores, while Consumer Services is the worst. Looking at just the Bull/Bear combination, Utilities is way out in front, indicating excellent relative performance (on average) in extreme market conditions (although it is mainly due to its robust Bear score), as Technology has fallen back. In fact, Technology and Financial share the lowest Bull/Bear combo score, indicating investor avoidance (relatively speaking) during extreme conditions, even though they have the highest Outlook scores. Keep in mind, the Outlook score relies solely on fundamentals with a strong forward-looking emphasis, while the Bull and Bear scores reflect actual investor behavior over the recent past, so they are measuring totally different things.
This week’s Outlook scores represent the view that Technology and Financial sectors are relatively undervalued, while Consumer Services and Telecom may be relatively overvalued based on our 1-3 month forward look.
Stock and ETF Ideas:
Our Sector Rotation Model, which appropriately weights Outlook, Bull, and Bear scores in accordance with the overall market’s prevailing trend (bullish, neutral, or bearish), continues to suggest holding Technology (IYW), Financial (IYF), and Healthcare (IYH) in the current bullish climate. (We consider the bias to be bullish because the SPY is still above its 50 and 200-day simple moving averages. Note: If you are more comfortable moving to a neutral bias at this time, the model suggests replacing Healthcare with Utilities.)
Other ETFs that are ranked high by our algorithm from the Technology, Financial, Healthcare, and Utilities sectors include First Trust NASDAQ Technology Dividend Index Fund (TDIV), PowerShares KBW High Dividend Yield Financial Portfolio (KBWD), Market Vectors Pharmaceutical ETF (PPH), and ProShares Ultra Utilities (UPW).
For an “enhanced” sector portfolio that employs top-ranked stocks (instead of ETFs) from within Tech, Financial, and Healthcare, some long ideas include Anixter International (AXE), F5 Networks (FFIV), BofI Holdings (BOFI), SVB Financial Group (SIVB), Actavis plc (ACT), and Biogen Idec (BIIB). All are ranked highly in the Sabrient Ratings Algorithm and score within the top two quintiles of our Earnings Quality Rank (EQR), which is a pure accounting-based risk assessment signal based on the forensic accounting expertise of our subsidiary Gradient Analytics.
On the other hand, if you have a bearish outlook on the market, our Sector Rotation Model would suggest holding Utilities (IDU), Technology (IYW), and Consumer Goods (IYK).
The author has no positions in stocks or ETFs mentioned. The materials available from us are published solely for informational purposes. They are not to be construed as advice or recommendations.


