
Sector Detector: Doomsayers Help Keep Bull Market Alive And Well
Bulls continue to climb their wall of worry, as uncertainty from the latest “bricks in the wall” created by Russia in Crimea, slowing growth in China, and Fed tapering fades into the mosaic. Thus, stocks continued their relentless climb last week, hitting yet another new intraday high -- but notably not a new closing high -- while global IPO volumes for 2014 hit $38 billion year-to-date (which is about double last year’s level), and the Federal Reserve’s balance sheet expanded to a new all-time high. Cautious optimism among investors is the prevailing sentiment, as opposed to the levels of extremes proclaimed by growing chorus of negativity. In fact, it seems that the doomsayers are helping keep the bull market from getting out of control -- and keeping it healthy, too.
Comments following the FOMC meeting last Wednesday about its expectations for economic growth and forward guidance on its flexibility to react to economic data regarding interest rates caused some consternation, but then the Fed announced that 29 of 30 banks passed the annual U.S. bank stress test, which was well received. Nevertheless, global investors continue to buy U.S. Treasuries as other countries like China and Japan seek to depress their currencies relative to the dollar. The 10-year yield closed Friday at 2.75% (versus a 52-week high of 3.06% and 52-week low of 1.62%).
Among the ten U.S. business sectors, Telecom, Financial, and Technology were each up more than 2% last week. Utilities is still the leader year-to-date, followed by Healthcare, and these were the first quarter leaders last year, as well. However, Utility stocks are often considered to be substitutes for bonds by income-seeking investors, so any hint of rising interest rates hits this sector, as we saw last week. After showing impressive strength the prior week, the Utilities sector was hit particularly hard on Wednesday and may be forming a bearish double-top on its chart.
Of course, with valuation multiples continuing to climb, the bearish voices are growing louder, with the inevitable comparisons to previous periods of extreme optimism and irrational exuberance. The average P/E for the S&P 500 is now 16.5x on a 12-month trailing basis and around 15.5x on a forward-basis (based on Wall Street consensus estimates, which many consider overly optimistic even after recent downward revisions). However, it seems to me that there are far too many investors who are either betting against this market, steering clear, or raising cash, to conclude that bullishness is over the top.
There is little in the way of pricing power, capital expenditures, or wage growth, as much of the high levels of corporate cash is being used for acquisitions and share buybacks, which help keep multiples under control to some extent -- but not in a long-term sustainable way. Eventually, we have to see capital investment in tangible assets like property, plant, and equipment (PP&E) and new hiring to create top-line growth, and there is an expectation among the analyst community that such capex investment is on the way. At the forefront of this anticipated trend is none other than Warren Buffett and Berkshire Hathaway. In his annual letter to shareholders, he reported no share buybacks at current valuations but plenty of investment in PP&E.
The CBOE Market Volatility Index (VIX), a.k.a. “fear gauge,” closed Friday right at the 15.00 threshold, which is slightly elevated from recent periods of market strength, and is giving us some indication that investors are growing more cautious.
SPY chart review:
The SPDR S&P 500 Trust (SPY) closed Friday at 186.20, after hitting a new 52-week intraday high earlier in the day at 189.02. Interestingly, its highest closing price is still 188.26 from March 7. After a pullback from overbought conditions at the top of the long-standing rising channel, SPY found support at prior resistance-turned-support at 185, which is where it bounced last week. However, it simply bounced into a sideways consolidation range to allow the oscillators (like RSI and MACD) to work their way back down below the neutral line, and now there appears to be a neutral symmetrical triangle forming. As price gets near the apex of the triangle and Bollinger Bands pinch together, we should see a break one way or the other very soon. Also, it appears that the pullback from overbought the other week might have created a bull flag pattern, which may be indicating that the next break will be to the upside.
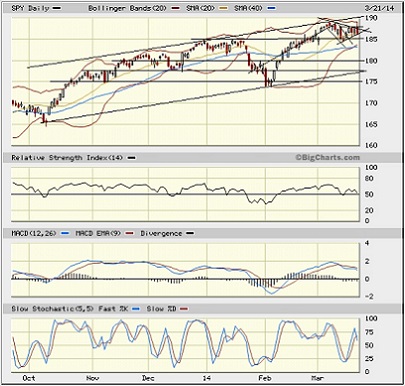
However, if SPY declines further, there are plenty of support levels to cushion the fall, starting with the 50-day SMA (near 183), the 100-day SMA (near 181), round-number support at 180, and the bottom of the rising channel (currently near 177.5).
Latest sector rankings:
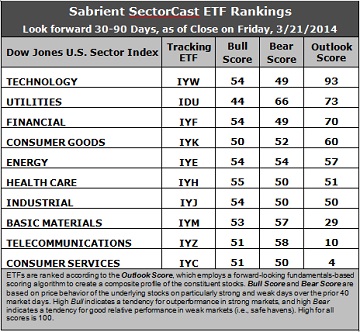
Relative sector rankings are based on Sabrient’s proprietary SectorCast model, which builds a composite profile of each equity ETF based on bottom-up aggregate scoring of the constituent stocks. The “Outlook Score” employs a forward-looking, fundamentals-based multifactor algorithm considering forward valuation, historical and projected earnings growth, the dynamics of Wall Street analysts’ consensus earnings estimates and recent revisions (up or down), quality and sustainability of reported earnings (forensic accounting score), and various return ratios. It helps us predict relative performance over the next 1-3 months.
In addition, SectorCast computes Sabrient's Bull Score and Bear Score for each ETF based on recent price behavior of the constituent stocks on particularly strong and weak market days. High Bull score indicates that stocks within the ETF have tended recently toward relative outperformance when the market is strong, while a high Bear score indicates that stocks within the ETF have tended to hold up relatively well (“safe havens”) when the market is weak.
Outlook Score is forward-looking while Bull and Bear are backward-looking. As a group, these three scores can be helpful for positioning a portfolio for a given set of anticipated market conditions. Of course, each ETF holds a unique portfolio of stocks and position weights, so the sectors represented will score differently depending upon which set of ETFs is used. For Sector Detector, I use the iShares that represent the ten major U.S. business sectors: Financial, Technology, Industrial, Healthcare, Consumer Goods, Consumer Services, Energy, Basic Materials, Telecom, and Utilities. Whereas the Select Sector SPDRs only contain stocks from the S&P 500, I prefer the iShares for their larger universe and broader diversity. Fidelity also offers a group of sector ETFs with an even larger number of constituents in each.
Here are some of my observations on this week’s scores:
1. Technology (IYW) is once again in the top spot with a strong Outlook score of 93. Anything above 90 is impressive and highly notable. Utilities (IDU) has jumped back into second place in its weekly battle with Financial (IYF), scoring a 73. Technology has consistently displayed solid factor scores across the board, with a strong forward long-term growth rate, a relatively low forward P/E, the highest return ratios, and excellent sentiment among Wall Street’s sell-side analysts (net positive revisions to forward earnings estimates) and company insiders (open market buying). The Utilities sector displays a relatively low forward P/E and notably positive sentiment among sell-side analysts. Financial is third at 70, followed by Consumer Goods (IYK) and Energy (IYE).
2. Consumer Services (IYC) has fallen back in the cellar with an Outlook score of 4, as the retail sector continues to see cuts to forward guidance and negative earnings revisions by Wall Street. Consumer Services, a.k.a., consumer cyclicals or consumer discretionary, displays a relatively high forward P/E and weak sentiment among both Wall Street analysts and company insiders. Telecommunications (IYZ) is again in the second worst spot, scoring a 10 this week, as it continues to display among the lowest scores on most of the factors in the model, including the highest (worst) forward P/E, lowest return ratios, and a low projected long-term growth rate.
3. Overall, although Tech and Financial remain strong, the strong Outlook scores of defensive sectors like Utilities and Consumer Goods keeps up the near-term caution flag from a fundamental standpoint.
4. Looking at the Bull scores, Healthcare has been the leader on strong market days, scoring 55, with Tech, Financial, Energy, and Industrial right behind at 54, while Utilities (IDU) is the laggard with a score of 44. The top-bottom spread is 11 points, reflecting moderately high sector correlations on particularly strong market days. It is generally preferable in a healthy market to see the top-bottom spread approach 20 points.
5. Looking at the Bear scores, Utilities scores a 66, giving a clear indication that stocks within this sector are the preferred “safe havens” on recent weak market days. Tech and Financial score the lowest with a 49. The top-bottom spread is 17 points, reflecting relatively low sector correlations on weak market days, which is a good sign for a healthy market. But it is preferable in a healthy market to see a spread of 20 points.
6. Overall, Technology easily displays the best all-weather combination of Outlook/Bull/Bear scores, while Consumer Services is the worst. Looking at just the Bull/Bear combination, the odd couple of Utilities and Basic Materials (IYM) share the lead, indicating superior relative performance (on average) in extreme market conditions. Telecom is right behind them, and all three are led by their Bear scores. Consumer Services scores the lowest, followed by Consumer Goods, indicating investor avoidance (relatively speaking) during extreme conditions.
These Outlook scores represent the view that Technology and Utilities sectors are relatively undervalued, while Consumer Services and Telecom may be relatively overvalued based on our 1-3 month forward look.
Stock and ETF Ideas:
Our Sector Rotation Model, which appropriately weights Outlook, Bull, and Bear scores in accordance with the overall market’s prevailing trend (bullish, neutral, or bearish), continues to suggest holding Technology (IYW), Financial (IYF), and Healthcare (IYH) in the current bullish climate. (We consider the bias to be bullish because the SPY is still above its 50 and 200-day simple moving averages. Note: If you are more comfortable moving to a neutral bias at this time, the model suggests replacing Healthcare with Utilities.)
Other ETFs that are ranked high by our algorithm from the Technology, Financial, Healthcare, and Utilities sectors include ProShares Ultra Technology (ROM), First Trust NASDAQ ABA Community Bank Index Fund (QABA), SPDR S&P Pharmaceuticals ETF (XPH), and ProShares Ultra Utilities (UPW).
For an “enhanced” sector portfolio that employs top-ranked stocks (instead of ETFs) from within Tech, Financial, and Healthcare, some long ideas include SanDisk (SNDK), Apple (AAPL), KeyCorp (KEY), SVB Financial Group (SIVB), Actavis plc (ACT), and Celgene (CELG). All are ranked highly in the Sabrient Ratings Algorithm and score within the top two quintiles of our Earnings Quality Rank (EQR), which is a pure accounting-based risk assessment signal based on the forensic accounting expertise of our subsidiary Gradient Analytics.
On the other hand, if you have a bearish outlook on the market, our Sector Rotation Model would suggest holding Utilities (IDU), Technology (IYW), and Energy (IYE).
The author has no positions in stocks or ETFs mentioned. The materials available from us are published solely for informational purposes. They are not to be construed as advice or ...


