
Safe Assets In The U.S. Economy
from the St Louis Fed
--this post authored by Fernando Martin, Research Officer and Economist
In the postwar era, financial assets in the U.S. have grown significantly. Yet, the proportion of assets that can be deemed "safe" has remained remarkably stable.

These phenomena were documented and analyzed in a 2012 article by economists Gary Gorton, Stefan Lewellen and Andrew Metrick. [1]," American Economic Review, 2012, Vol. 102, Issue 3, pp. 101-106. In this post, I will revisit some salient points of their study, using the most recent data.
What Are Safe Assets?
Gorton, Lewellen, and Metrick applied a narrow definition to safe assets, including only those that are used, directly or indirectly, to facilitate transactions, i.e., in a money-like fashion. The reason some safe assets are used in transactions is that they are “information-insensitive:" agents do not worry about the health of the issuer.[2]
These safe, information-insensitive assets are a specific set of liabilities (i.e., debt) issued by the government and the financial sector. Some of these assets, like bank deposits, can be used directly to make payments or quickly transformed into means of payment; others, like Treasuries and securitized private debt, are widely used as collateral in financial transactions. On the other hand, bank equity is not an information-insensitive asset, as its value varies with the perceived health of the entity.
Share of Safe Assets
Between 1955 and 1980, the ratio of total financial assets to gross domestic product (GDP) was relatively stable, around five times GDP on average. This ratio then started a steady increase, briefly slowed down by recessions. Since 2017, financial assets have exceeded 12 times GDP. Despite this substantial growth, the fraction of safe assets relative to total financial assets has remained very stable, averaging 25 percent since 1955, as seen in the figure below.[3]
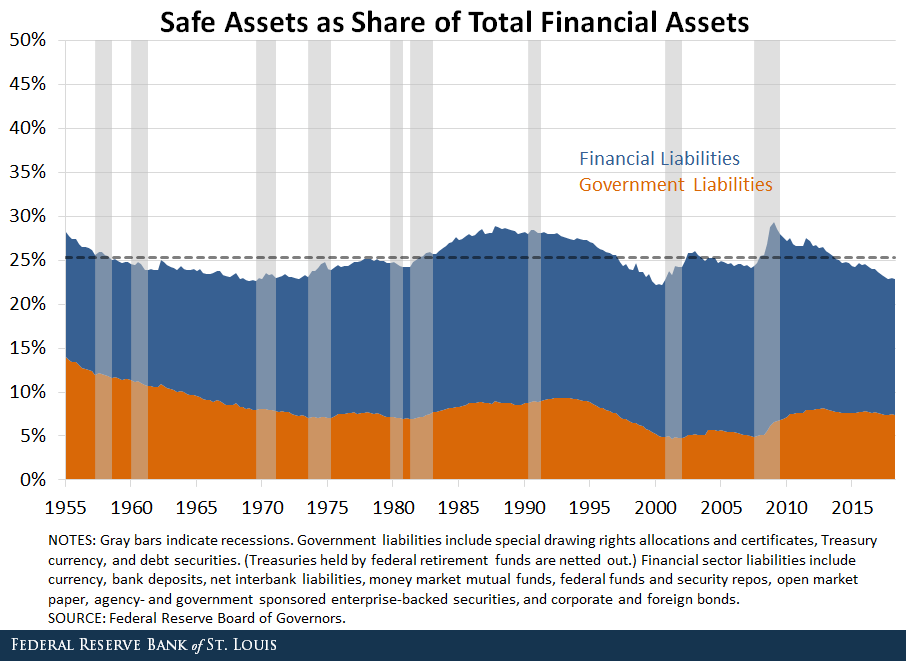
Besides the long-run stability of the fraction of safe assets, it is interesting to note that this proportion normally rises during recessions. This can be explained by the fact that recessions are often accompanied by a deterioration of the quality (creditworthiness) of financial assets in general, which makes safe assets more desirable.
Safe Assets’ Role as Money
A well-known fact is that money (defined as currency in circulation plus demand deposits, or M1), has shrunk significantly as a fraction of GDP in the postwar era.[4] To a large degree, this is because improvements in transactions and financial technologies have enabled agents to economize on the amount of money they need to hold to buy goods and services. However, when broadening the definition of money to include safe, information-insensitive assets as defined above, the opposite has happened. The figure below shows that the ratio of safe assets to GDP has more than doubled since the 1950s. Most of the increase happened during the first-half of the 1980s and during the 2000s.
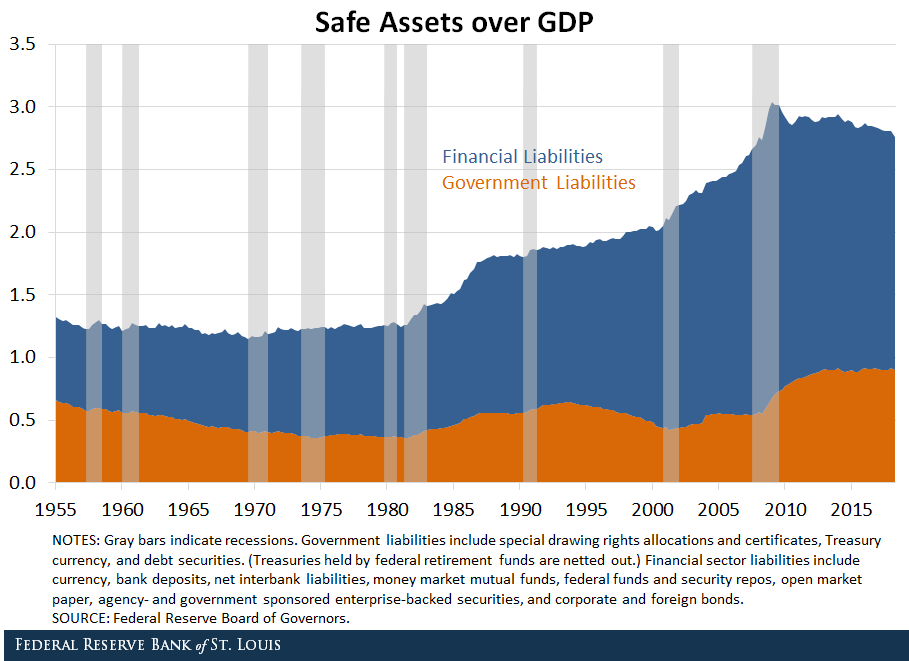
A way to reconcile these two observations is that safe assets are not only used to purchase goods and services, but also to support a wide array of financial transactions. This figure suggests that the prominence of these financial transactions has risen dramatically.
Safe Asset Composition
Almost all of the safe assets created by the government take the form of debt securities (mostly Treasuries). In contrast, the composition of safe assets created by the financial sector has been changing over time, as seen in the figure below.
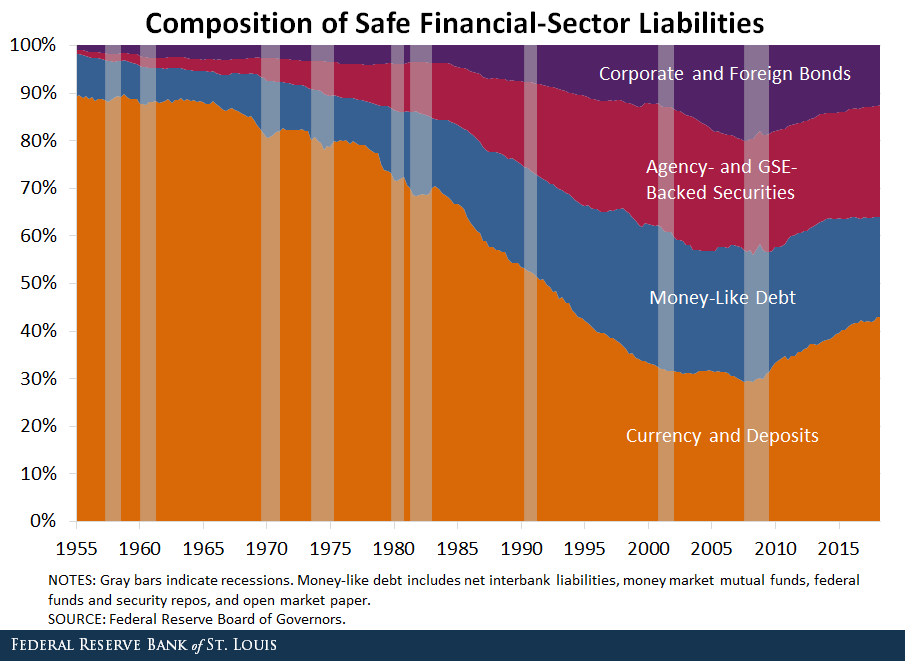
Back in the 1950s, 90 percent of financial-sector liabilities were in the form of currency and bank deposits. This fraction dropped steadily until hitting about 30 percent right before the last recession. It has increased since, rebounding to about 43 percent in the second quarter of 2018. What took the place of traditional currency and deposits to support transactions are money-like debt (such as mutual funds and repos) and agency- and government sponsored enterprise-backed securities. Corporate and foreign bonds issued by financial entities also played a role, but not as prominently.
Notes and References
1 Gorton, Gary; Lewellen, Stefan; and Metrick, Andrew. “The Safe-Asset Share," American Economic Review, 2012, Vol. 102, Issue 3, pp. 101-106.
2 Gorton, Gary; and Pennacchi, George. “Financial Intermediaries and Liquidity Creation," Journal of Finance, 1990, Vol. 45, Issue 1, pp. 49-71.
3 This measure of safe assets is more conservative than the one used in the article by Gorton, Lewellen and Metrick. Hence, the average fraction of safe assets is slightly lower than in their paper, which is between 31 and 33 percent, depending on the definition used.
4 The secular decline in M1 over GDP has reversed slightly since the last recession.
Additional Resources
- On the Economy: How Do Rising Short-Term Rates Affect Uncle Sam?
- On the Economy: Domestic Debt Before and After the Great Recession
- On the Economy: How Has Stock Ownership Trended in the Past Few Decades?
Disclaimer: Views expressed are not necessarily those of the Federal Reserve Bank of St. Louis or of the Federal Reserve System.
No content is to be construed as investment advise and all ...
more

