
S And P CoreLogic Case-Shiller 20 City Home Price Index October 2018 Year-Over-Year Growth Slowed
The non-seasonally adjusted S and P CoreLogic Case-Shiller home price index (20 cities) year-over-year rate of home price growth decelerated from 5.2 % (initially published as 5.1 %) to 5.0 %. The index authors stated "The combination of higher mortgage rates and higher home prices rising faster than incomes and wages means fewer people can afford to buy a house".

Analyst Opinion of Case-Shiller HPI
I continue to see this a situation of supply and demand. It is the affordability of the homes which is becoming an issue for the lower segments of consumers. With the rise in mortgage rates, it is pricing more and more consumers out of the market. If mortgage rates continue to rise - we likely will see some retrenchment in home prices.
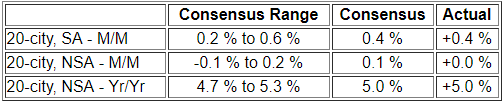
- 20 city unadjusted home price rate of growth decelerated 0.1 % month-over-month. [Econintersect uses the change in year-over-year growth from month-to-month to calculate the change in the rate of growth]
- Note that the Case-Shiller index is an average of the last three months of data.
- The market expected from Econoday:
S&P/Case-Shiller Home Price Indices Year-over-Year Change
(Click on image to enlarge)

Comparing the NAR and Case-Shiller home price indices, it needs to be understood each of the indices uses a unique methodology in compiling their index - and no index is perfect.
(Click on image to enlarge)

The way to understand the dynamics of home prices is to watch the direction of the rate of change. Here home price growth generally appears to be stabilized (rate of growth not rising or falling).
(Click on image to enlarge)

There are some differences between the indices on the rate of "recovery" of home prices.
A synopsis of Authors of the Leading Indices:
Case Shiller's David M. Blitzer, Chairman of the Index Committee at S&P Indices:
Home prices in most parts of the U.S. rose in October from September and from a year earlier. The combination of higher mortgage rates and higher home prices rising faster than incomes and wages means fewer people can afford to buy a house. Fixed rate 30-year mortgages are currently 4.75%, up from 4% one year earlier. Home prices are up 54%, or 40% excluding inflation, since they bottomed in 2012. Reduced affordability is slowing sales of both new and existing single family homes. Sales peaked in November 2017 and have drifted down since then.
The largest gains were seen in Las Vegas where home prices rose 12.8% in the last 12 months, compared to an average of 5.3% across the other 19 cities. This is a marked change from the housing collapse in 2006-12 when Las Vegas was the hardest hit city with prices down 62%. After the last recession, Las Vegas diversified its economy by adding a medical school, becoming a regional center for health care, and attracting high technology employers. Employment is increasing 3% annually, twice as fast as the national rate.
CoreLogic believes affordability is slowing home price growth (November 2018 Data). Per Dr. Frank Nothaft, chief economist for CoreLogic and Frank Martell, president and CEO of CoreLogic stated:
Rising prices and interest rates have reduced home buyer activity and led to a gradual slowing in appreciation. October's mortgage rates were the highest in seven and a half years, eroding buyer affordability. Despite higher interest rates, many renters view a home purchase as a way to build wealth through home-equity growth, especially in areas where rents are rising quickly. These include the Phoenix, Las Vegas and Orlando metro areas, where the CoreLogic Single-Family Rent Index rose 6 percent or more during the last 12 months.
.... Homeownership remains an important part of the American dream. Our research found that being a homeowner makes consumers feel safe in their homes. Renters really want something to call their own. However, until affordability comes back into balance, renters will have a hard time purchasing a home.
The National Association of Realtors also worries about affordability (October 2018 data):
Lawrence Yun, NAR's chief economist, says two consecutive months of increases is a welcomed sign for the market. "The market conditions in November were mixed, with good signs of stabilizing home sales compared to recent months, though down significantly from one year ago. Rising inventory is clearly taming home price appreciation."
"A marked shift is occurring in the West region, with much lower sales and very soft price growth," says Yun. "It is also the West region where consumers have expressed the weakest sentiment about home buying, largely due to lack of affordable housing inventory."
"Inventory is plentiful on the upper-end, but a mismatch between supply and demand exists at affordable price points," Yun added. "Therefore, facilitating real estate development of affordable housing units in designated Opportunity Zones can provide better housing access in addition to boosting the local economy."
"It is not surprising to see homes remain on the market a little longer," said NAR President John Smaby, a second-generation Realtor® from Edina, Minnesota and broker at Edina Realty. "Buyers can often negotiate a more favorable price in those circumstances, especially when paired with a motivated seller and the aid of a Realtor® familiar with their local market."
The U.S. Federal Housing Finance Agency produces an All-Transactions House Price Index for the United States:
(Click on image to enlarge)

Econintersect publishes knowledgeable views of the housing market.
Caveats on the Use of Home Price Indices
The housing price decline seen since 2005 varies by zip code - and seems to have ended somewhere around the beginning of the 2Q2012. Every area of the country has differing characteristics. Since January 2006, the housing declines in Charlotte and Denver are well less than 10%, while Las Vegas home prices had declined almost 60%.
Each home price index uses a different methodology - and this creates slightly different answers.
The most broadly based index is the US Federal Housing Finance Agency's House Price Index (HPI) - a quarterly broad measure of the movement of single-family house prices. This index is a weighted, repeat-sales index on the same properties in 363 metro centers, compared to the 20 cities Case-Shiller.
The US Federal Housing Finance Agency also has an index (HPIPONM226S) based on 6,000,000 same home sales - a much broader index than Case-Shiller. Also, there is a big difference between home prices and the owner's equity (OEHRENWBSHNO) which has been included in the graph below.
Comparing Various Home Price Indices to Owner's Equity (blue line)
(Click on image to enlarge)

(Click on image to enlarge)

The affordability factor favors rental vs owning.
Price to Rent Ratio - Indexed on January 2000 - Based on Case-Shiller 20 cities index ratio to CPI Rent Index
(Click on image to enlarge)

Disclaimer: No content is to be construed as investment advise and all content is provided for informational purposes only.The reader is solely responsible for determining whether any investment, ...
more

