
Russell 2000 Breaks From Rising Channel
It sounds worse than it probably is, but the Russell 2000 dropped from its prior rising support trend but still managed to hold above $162.33 (IWM) and in all likelihood is moving to a new sideways consolidation pattern - but for now, must be considered a breakdown until price action can be determined. Technicals show a MACD trigger 'sell' and a relative performance loss.
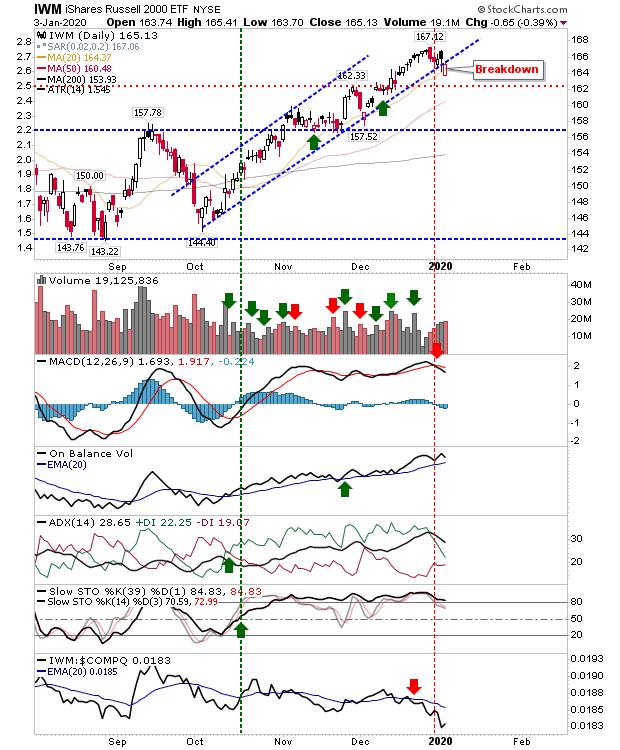
The weekly chart of the Russell 2000 is still recovering from a sustained downward trend in relative performance dating back to the middle of 2018. Relative performance has turned negative as of last week, likely suggesting another period of sideways price action (as happened in 2019) is about to kick in.

The S&P had already breached its rising trend in December and relative performance (vs the Russell 2000) has only recently kicked in. There is a new support trend line to work with but there hasn't been too much else of note.

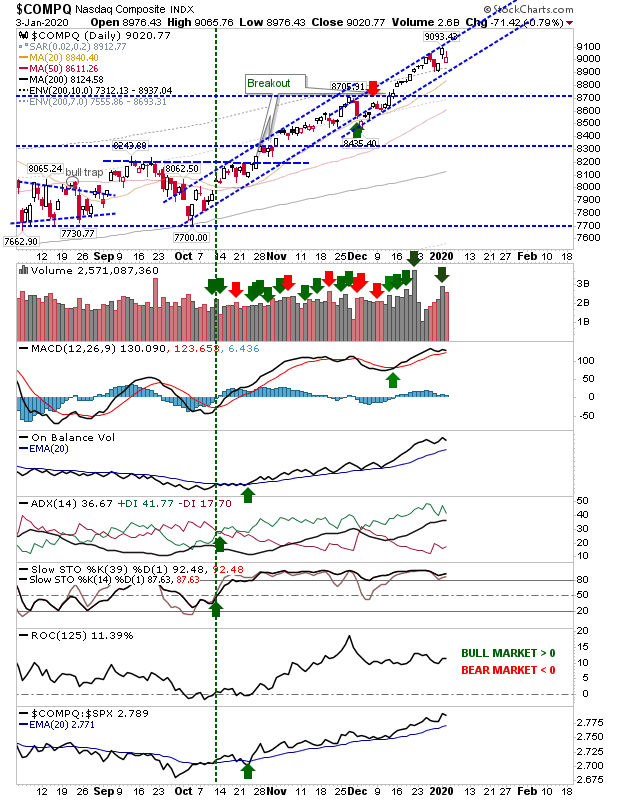
The Nasdaq too is working inside an adjusted rising channel, but has outperformed both the S&P and Russell 2000 in relative performance. Technicals are all bullish and future tests of rising support are buying opportunities.
The New Year has started as the old one finished. Things will eventually slow but there is no sign of that now.


