
Running Into Resistance
- SPX Monitoring purposes; Sold SPX on 2/12/19 at 2744.73 gain 1.36%; long 2707.89 on 2-8-19.
- Monitoring purposes GOLD: Long GDX on 1/29/19 at 21.96.
- Long Term Trend SPX monitor purposes; Long SPX on 10-19-18 at 2767.78
(Click on image to enlarge)
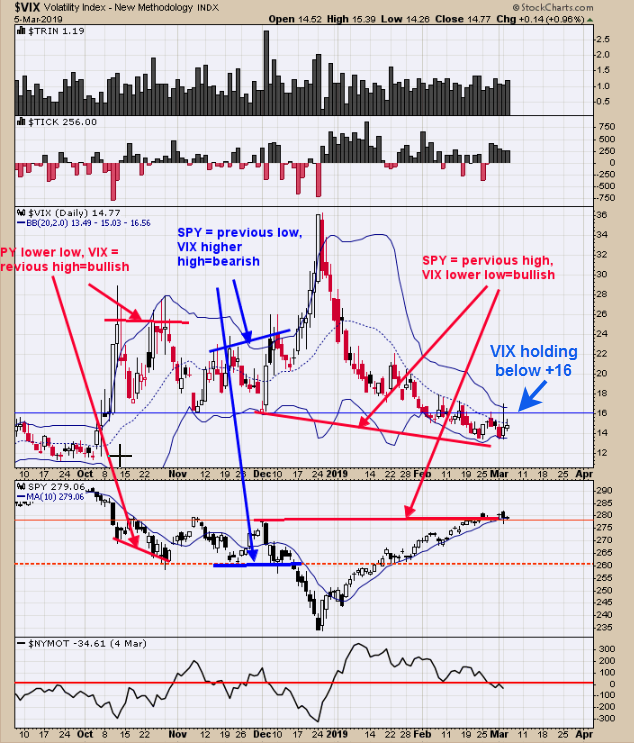
We have updated this chart from yesterday which is the VIX. SPY is in an uptrend when VIX is < +16 and in a downtrend when >+16; close today was +14.77.SPY is running into resistance near the 280 level which is the November and December 2018 highs but is not backing away from those highs suggesting the market may “eat” through this resistance. Next Week is Option Expiration week which normally has a bullish bias and the week before (this week) can produce short term whipsaws. The VIX trades opposite of SPY. The VIX has made lower lows below the November and December highs suggesting at some point the SPY will break above the November, December highs (280 SPY range). Seasonality shows market could be still until Tuesday or Wednesday of next week after which it turns bullish into month end. A bullish setup could be triggered in the coming days.
(Click on image to enlarge)
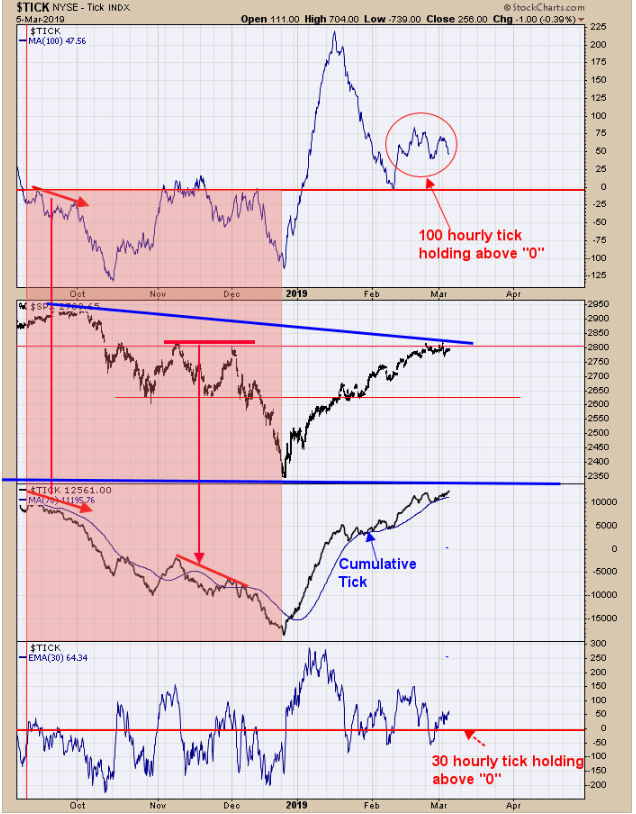
SPX is running into resistance at the November December highs near the 2800 level. The 2800 SPX level is not produce negative ticks readings (which would be a bearish sign) but staying positive. The 100 hourly moving average remains above “0” closing at +47.56 (top window). The 30 hourly tick (bottom window) remains above “0” closing at +64.34 and actually gained ground. The next window up is the hourly cumulative tick which remains in an uptrend and bullish. So far these three different configurations of the tick show a bullish bias for the SPX. For a bullish setup, we would like to see a rising TRIN reading to add power to the next rally which could develop in the coming days. Not showing a clear signal here but tick and VIX readings are showing a bullish bias.
(Click on image to enlarge)
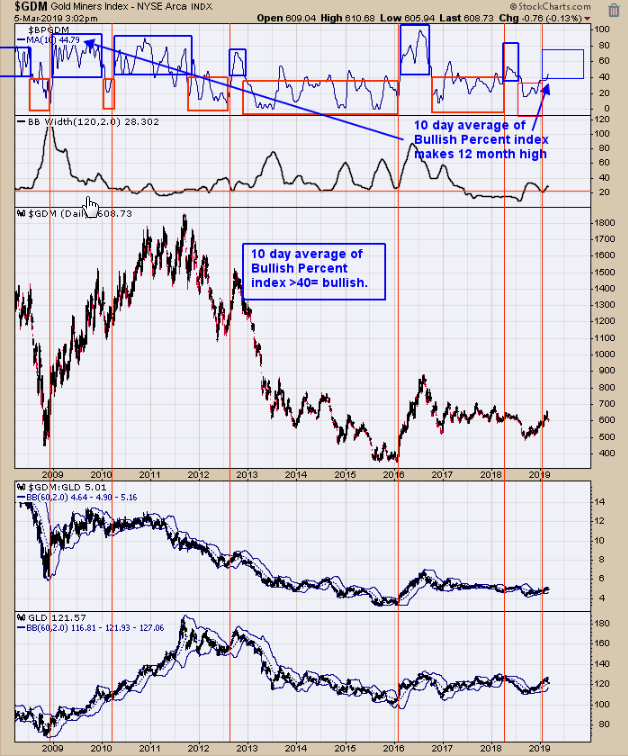
The top window is the 10 day average of the Bullish Percent index for the Gold miner’s index. The Bullish Percent index measures the percent of stocks that are on Point and Figure buy signals in an index and in this case it’s the Gold Miners index. We have drawn red verticals lines where the 10 day average of the Bullish percent index exceeded 40% (current reading is 44.78%) which represent an uptrending market. As long as 10 day average of the Bullish Percent index stays above 40% the uptrend in the Gold Miner’s index should continue. Signals in the past can last a year or longer. Yesterday the Bullish Percent index for the Gold Miners index increased to 46.15% up from 44.44% last week showing this index is getting stronger. Long GDX on 1/29/19 at 21.97.
Disclaimer: Signals are provided as general information only and are not investment recommendations. You are responsible for your own investment decisions. Past performance does not guarantee future ...
more

