
Risk/Reward Proposition Increasingly In Question As Coronavirus Lingers
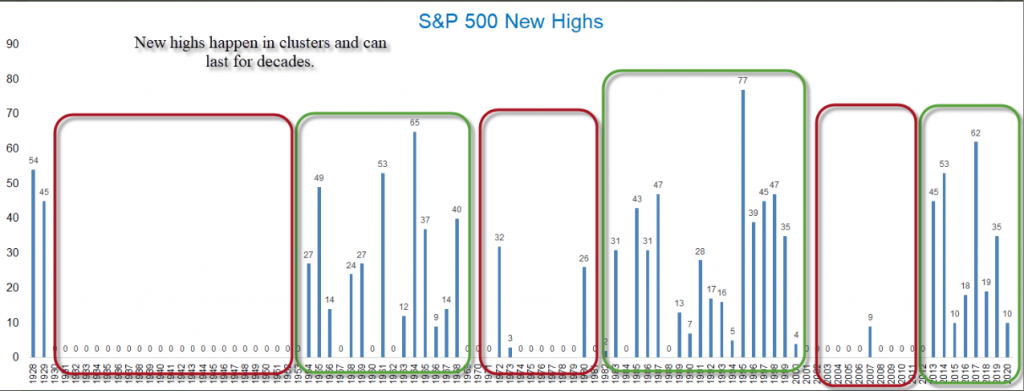
Since displacing the gains from January, which I believe is the best term to use, the S&P 500 (SPX) has more than recaptured those gains by closing out the 2nd trading week in February at record-level highs. If it seems as though we continue to use the phrase record-level highs quite often, that's likely because such achievements tend to cluster together. Investors have witnessed stocks surging to a series of 12 new closing highs achieved by the S&P 500 in the first 32 trading days of 2020.
For the week in review, the S&P 500 had to travel just outside of the $52/point weekly expected move (as priced by the options market) in order to achieve another record closing high. Oddly enough, however, the benchmark index pulled right back into the weekly expected move to finish the week up another 1.58% and with a year-to-date gain of 4.62 percent. I will put the January gains into perspective within this week's report, but I'd feel remiss if I didn't point out one of the factors that has led the market to such gains in the face of exogenous epidemic headlines, technology stocks. While the S&P 500's gains are nothing to "sneeze at", the tech-heavy Nasdaq (NDX) is dwarfing the S&P 500's YTD gains with a return of 8.45% already in 2020.
The market has been doing what it does best, prove the disbelievers wrong and climbing the proverbial wall of worry! The recession calls from 2019 over the tax cuts have now turned into recession calls from the Coronavirus, now named COVID-19. Investors certainly shouldn't dismiss the severity of the epidemic, as it has proven to diminish economic activities in the world's 2nd largest economy, but there's more to consider than any singular bearish narrative or temporary macro concern. Additionally, COVID-19 and the global response is now a known factor. There is actually less unknown about it's potential impact and about the world's response to COVID-19 than with previous outbreaks. These issues almost never materialize the way headlines claim they will. It often proves more prudent to recognize the headlines as another fleeting concern that soon shall pass. But until it does pass...
All Things S&P 500
Equity investors are always faced with challenges to their portfolios each and every week. There is always a narrative suggesting "the end is near". I encourage investors to ignore these narratives in favor of the long-term trajectory of the S&P 500, which is evidenced since its genesis. The market goes up over time and it is largely predicated upon earnings growth, despite the narrative surrounding central bank liquidity provisions for the debt markets. While we don't dismiss central bank liquidity as providing a sentimental push in favor of equities, as they lower risk-free yields, that is all they can do, offer a sentimental nudge in the direction of equities. Speaking of global liquidity, money supply plays a critical role in economic activity and financial markets. As money supply increases, equity markets are found with greater favor.
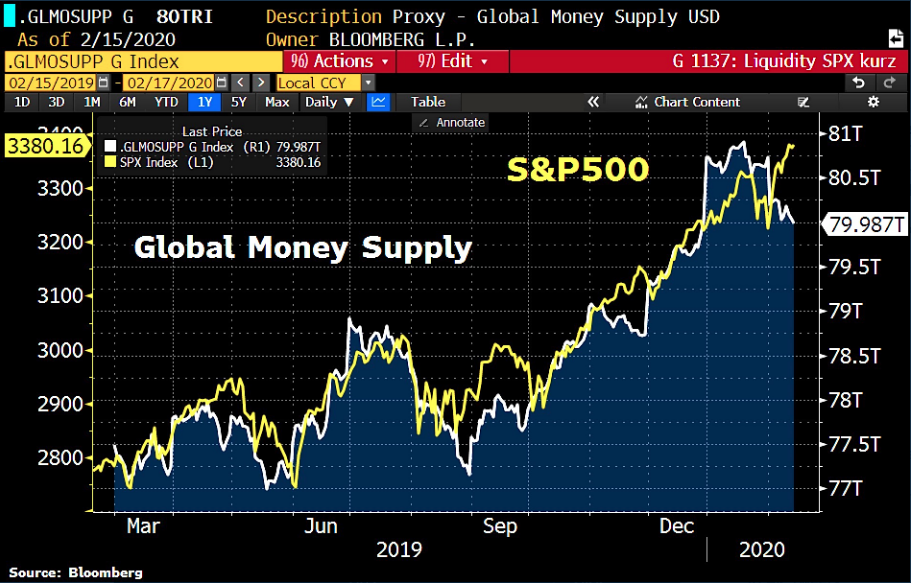
The path of money supply and the S&P 500 are inarguably linked over time. When a gap opens between the two, it often closes and rather quickly. This, however, is just one of many reasons the S&P 500 travels higher over time and not the only reason. It's the same for worries as to why, in the interim, the market can decline. There is no one reason why the market can and will decline in the interim, there are many reasons. It actually brings us joy that so many market participants continue to rebuild a wall of worry that bullish investors keep dismantling brick by brick and year after year.
The stock market is a driver of truth, with finite outcomes. Every week I hear from another market pundit who wants to argue with the stock market, always proclaiming their view is better, and they publish a novel to remind investors of why the market is wrong when in fact the market is always right and the human condition of needing to find validation is where errors are produced. Brick by brick! It's quite remarkable. Alright, let's get into some stats and charts folks!
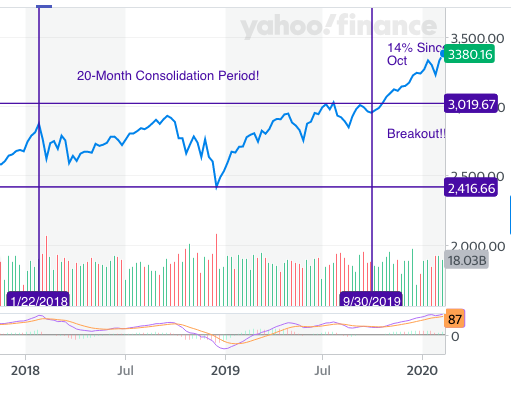
While I discuss mostly the S&P 500, which had clearly broken out of a 20-month long consolidation period as of October 2019, many are of the opinion it has traveled too far too fast.
I don't discount this subjective sentiment. That is certainly a sizable return in a rather condensed time frame. Nonetheless, it is a sizable return for cause. That cause centers on a plethora of investor beliefs and encourages investors to revisit the narrative that produced the 2018, 20% technical bear market.
- Central bank policy will remain accommodative.
- Earnings are expected to rebound in 2020.
- A recession remains unlikely in 2020.
- Election years tend to produce returns with incumbent seeking re-election.
Some of these beliefs will and always do come under question with each macro issue that pops up on the global stage. Even so, the one variable not in question is the desire and ability of central banks to backstop economic turmoils and financial market calamities. Investors have taken to adopt the credo, "In central banks we trust".
Consolidation periods often find investors thinking more about the present and less about the past. They forget how long the market proved stagnant and went nowhere and how powerful breakouts can prove to be and have proven in the past. Another similar consolidation has occurred in the Global Dow over the last couple of years. As it was with the S&P 500, the Global Dow could be on the verge of it's own breakout near-term.
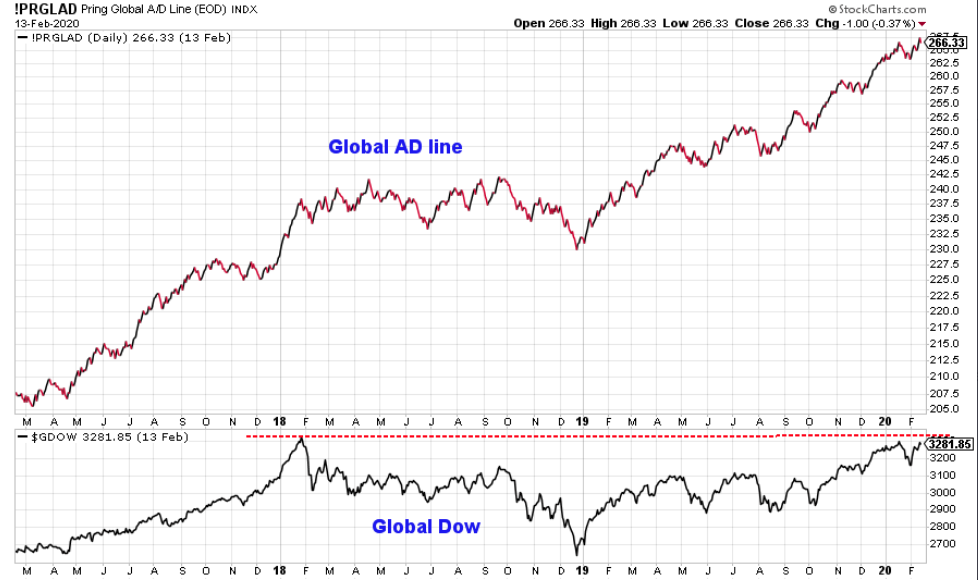
According to Ryan Detrick of LPL Financial, there are 2 things to consider with the charts positioned above.
- The Global A/D line continues to make new highs.
- The Global Dow has gone nowhere for more than 2 years
What we know about A/D lines is that they tend to lead the Global Dow. With new highs in the Global Dow being achieved and with the Global Dow bordering on it's previous record highs, it serves to consider that this index too is likely to set a new high in 2020. To repeat, global stocks have gone nowhere for two years. So while we continue to hear that the S&P 500 or Nasdaq have come to far too fast, you might consider the aforementioned Global Dow that is only now on the verge of record highs.
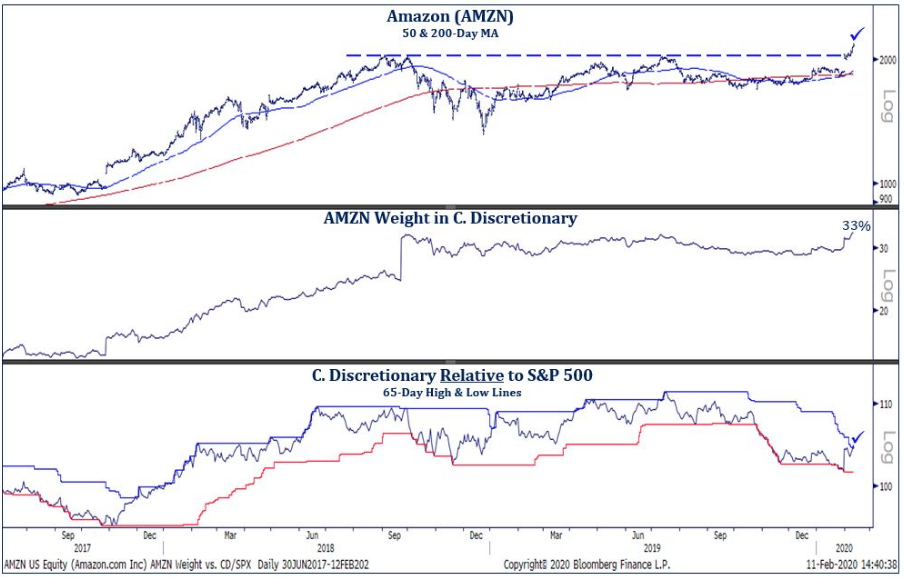
Based on that narrative surrounding the Global Dow and juxtaposing it with a 14%+ move in the S&P 500 since October 2019 might make it seem as though we still have room to the upside for the S&P 500, and we do. The only question is how do we achieve more upside. We assert that future gains will not all occur in a straight line and divergences in breadth and/or sentiment may be heralding such turbulence ahead, even if breadth remains at healthy levels. Recall what I said earlier about one of the reasons the market has continued to defy gravity by trekking higher, technology stocks. Amazon Inc. (AMZN) had a monster Q4 2019 period, beating analysts projections by a wide margin. The stock has been reward significantly since it reported results only a couple of weeks ago. The major breakout for AMZN shares has its sector weight now at new highs. In other words, "the big get more dominant" and carry greater weight in the index or ETF, thus pulling the index in the direction the stock is already trending.
In referencing the tech-heavy Nasdaq earlier, it's no wonder as to why it has continued to outperform the S&P 500. Moreover, the Nasdaq is now 17% above its 200-DMA. The index level is the most extreme reading in the last 17 years. Having said that, if we compare it to the 1999, dotcom era, it doesn't even come close to the extremes seen in those days. Back then, it was 50% above it's 200-DMA! Aggressive bull markets can stay irrational longer you some bears can stay solvent. (Chart from Yuriy Matso)
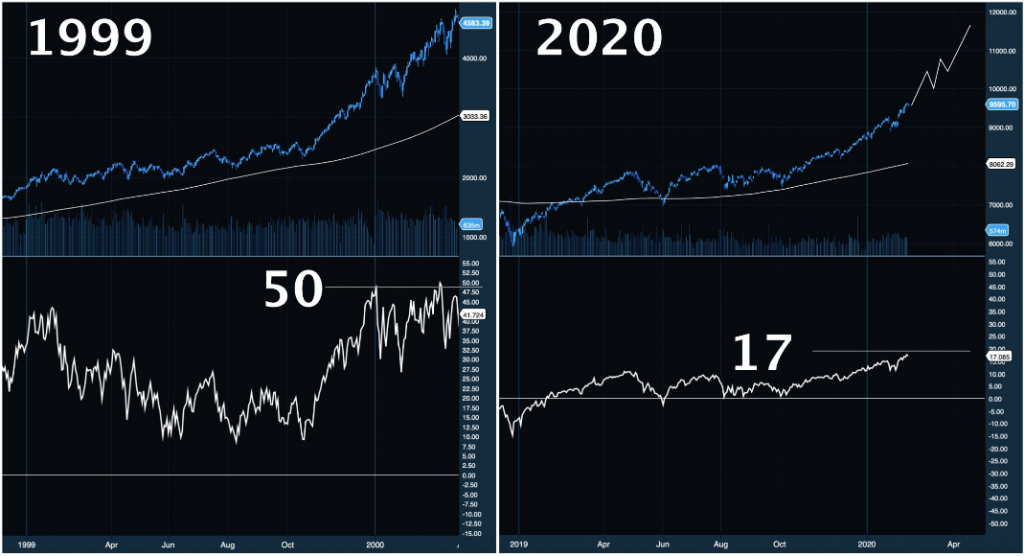
Is it fair to compare the Nasdaq today with the dotcom bubble that would soon pop thereafter 1999? Probably not, in our opinion as the market tends to teach lasting lessons and with the evolution of markets. But here's the key reason why we're discussing AMZN, Nasdaq and technology as a whole: The aforementioned stock, Index and/or sector tend to have high beta or greater volatility. As such, they tend to carry perceived greater risk. Risk appetite is a key sentiment gauge and can underscore market trends. It's another breadth indicator of sorts, which we discuss in most Research Reports. Breadth is a key component of market trends and can serve to signal an intermittent pause in a trend if not an outright trend reversal. Noted below are some key themes and definitions for which to use high beta/volatility stocks when evaluating market breadth/sentiment from Andrew Thrasher of Thrasher Analytics:
When risk appetite is high, we typically see higher beta stocks outperform the broad market, which makes sense – more bullishness sends traders to chase after the higher volatile components of the index.
This causes the correlation between the ratio of High Beta and the S&P 500 to remain relatively high when the index is in a positive trend. However, that relationship has broken down in recent weeks. In fact, high beta stocks are no longer outperforming. It’s not due to a lack of exposure to the stronger corners of the market, the Invesco S&P 500 High Beta ETF (SPHB) is 45% tech and its largest holdings are Advanced Micro Devices (AMD), NVIDIA (NVDA), Micron (MU), and Western Digital (WDC), so it’s not because tech is leaving the ETF behind. Instead it’s showing that traders are becoming more risk adverse during this latest move higher in the broad market. This has sent the correlation to the lowest level since during the Q4 ’18 sell-off.

It's hard to argue with the chart defined above. There is a clear shift in risk identified, even as the S&P 500 marched to new, record highs. In fact, the S&P 500 High Beta ETF is down nearly .5% over the last month while the S&P 500 is up almost 3 percent. But as is always the case, one breadth indicator weakness does not equate to a sell signal as there are a litany of breadth indicators to consider.
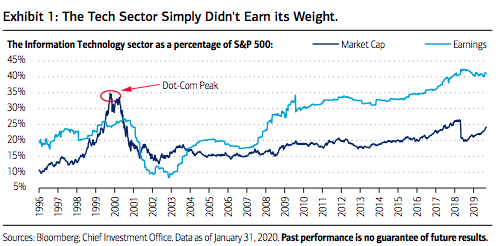
In speaking of the tech sector and comparisons to the dotcom era, I understand that today's stretched Nasdaq valuation/conditions are drawing comparisons from the pundits. But here are the facts, and they are undeniable.
- At the height of the tech bubble in 2000, the technology sector traded at a near 2.5x premium to the overall market on a price-to-earnings basis. Today, this premium is only 1.2x.
- Back then, the sector’s weight in the broader S&P 500 nearly doubled its earnings contribution, today, that story has reversed (Exhibit 1). The sector is not punching above its weight and has rightfully earned its outperformance and dominance in the current cycle.
- Also unlike 1999, the average technology company of today tends to be more mature, often delaying Initial Public Offerings (IPOs) in efforts of boosting profitability.
Another difference is that in 2000, the technology sector generated subzero free-cash-flow margins when accounting for employee stock options, according to Empirical Research Partners. That figure is currently 18%. Empirical also notes that expectations were much higher back in the late 1990s. Research analysts then estimated that the earnings of technology stocks would grow 4X as fast as that of the broad market's. Current expectations call for a 1.6x differential. Lower expectations and cheaper valuations compared to the late ‘90s keep us bullish on the sector in the long term, which is being driven by the accelerating digital transformation of enterprises and customer experiences on a global basis. These are the facts folks!
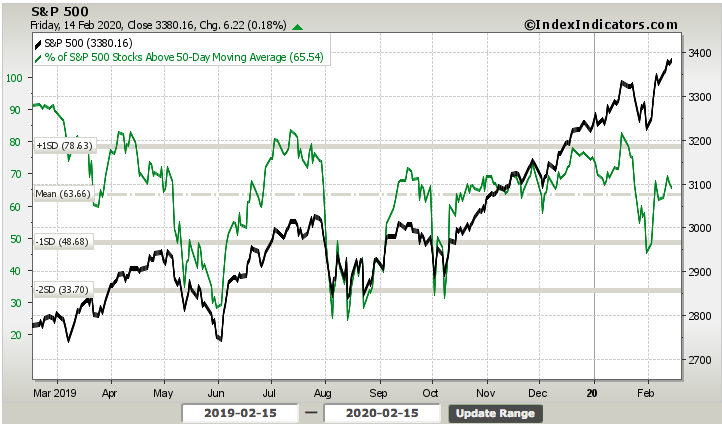
Valuation always matters, but it is often pushed out beyond the periphery of investors' considerations when a trend has taken hold and that trend seems irreversible. This goes for both downtrends and uptrends. With this in mind, both trends are always met with some form of mean reversion with the greatest consideration being paid to earnings over time. At present, the uptrend has been strong and healthy, but it is also a trend that has proven to find overbought and overextended conditions. For example, the S&P 500 has been above its 50-day SMA for 87 days now.

This is the 4th longest streak since 2009 and the longest streak since January 2018. Of course, nobody needs a reminder as to what happened a few trading days after January 2018 and into February 2018. In February 2018 and to it's lowest point, the market dropped roughly 13% from peak to trough. What goes up...
No matter how we look at the market, it is in overbought territory that is rarely not met with a corrective phase of sorts. I posted this chart of the S&P 500 during the trading week on Twitter, which was subsequently included in Jason Goepfert's weekly blog (SentimenTrader)
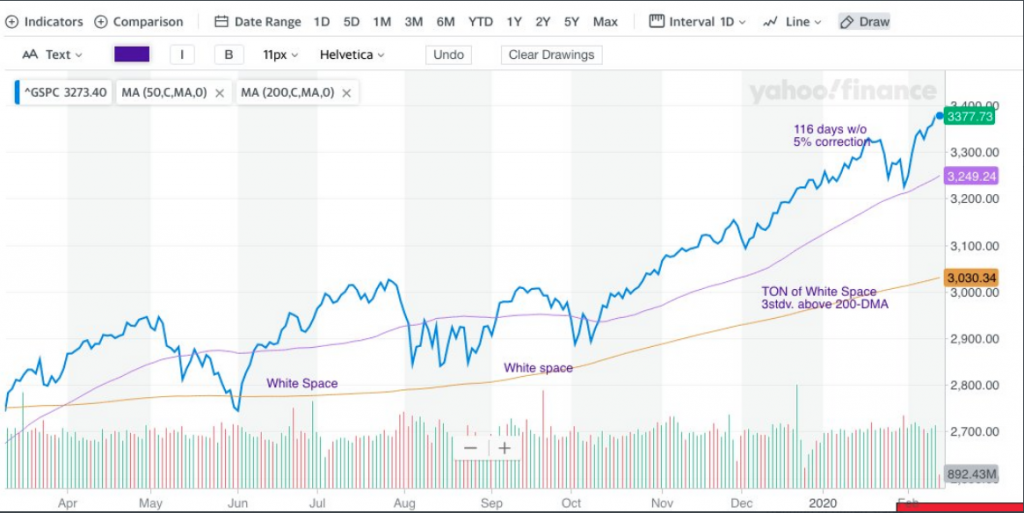
Within the chart, I identify all the white space between the 50, 200-DMA and the S&P 500 itself. Each time the benchmark index achieves such a distance above it's 50 or 200-DMA, it has corrected to one degree or another shortly thereafter. The recent 3% distribution phase, a couple of weeks ago, only found dip buyers in greater supply than sellers, quickly reverse the decline to record highs again. Such a chase for equities suggests pent-up demand underneath the market that should not be ignored or dismissed in our opinion. In that same breadth, neither should the extremes indicated in the chart.
The chart also identifies that the S&P 500 has now traveled 117 trading days without a 5% correction. It’s been almost 8 months since we’ve seen a 5% correction, one of the longest runs ever.

While one of the longest streaks ever, the most recent streak before this one was significantly longer and began in mid-2016. This streak was carried through the November 2016 presidential election, through the anticipated Tax Reform vote passage of 2017 and reached its culminating point in February 2018. Without a 5% correction over that 404 day period, valuations stretched to cyclical highs and a very hot wage inflation data point delivered in February 2018, the market found enough reasons to correct by roughly 13% thereafter. With this in mind and the current overbought conditions somewhat mirroring those of 2018, what more does the market need to experience in order to self-correct? With that question in mind, which obviously would require a crystal ball to answer, all we have is history to go by in order to assess the probabilities for market returns going forward under like circumstances. In order to assess those probabilities we refer to the blog from SentimenTrader as follows:
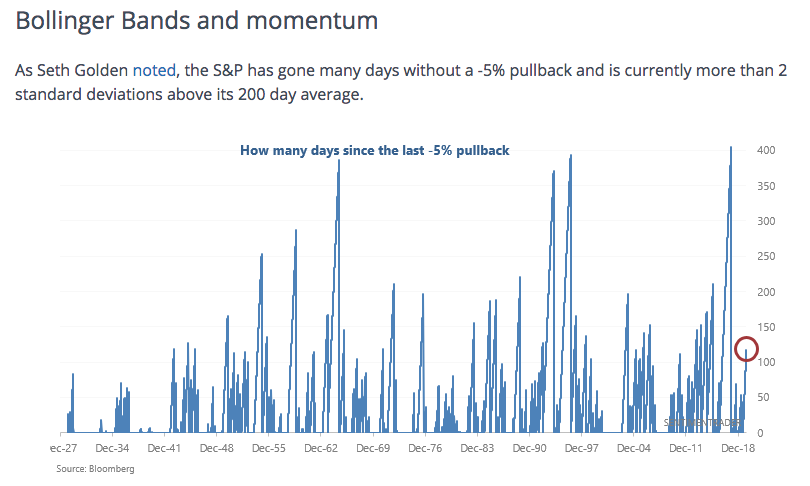
When the S&P 500 went 117 days without a -5% drawdown from 1-year highs while it was more than 2 standard deviations above its 200-DMA, the S&P 500's forward returns on nearly every time frame were more bullish than random. Hedge funds and asset managers whom are resourceful, utilize such data to make informed, probabilistic decisions when it comes to capital allocations.
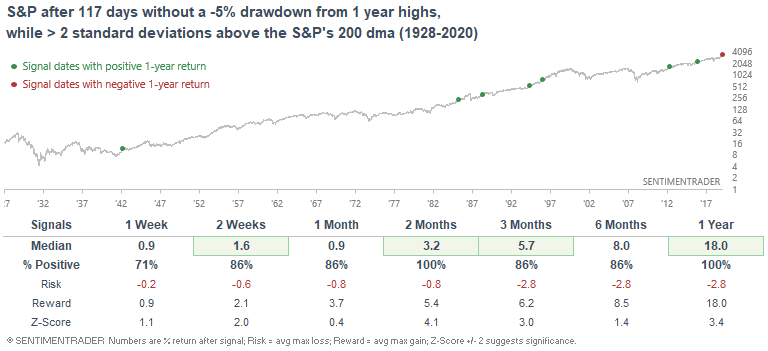
Jason Goepfert: "This is the main contradiction right now in stocks - things are stretched to a degree that usually precedes flat or negative returns over the short- to medium-term, but when it gets so stretched, it has an even stronger tendency to lead to higher returns longer-term."
Any near-term turbulence in the markets has always been met with long-term gains over time, this is the underlying theme of most any market study. Having said that, sentiment for equities remains favorable even without a 5% correction in some 117 trading days and with the S&P 500 trading 3 standard deviations above its 200-DMA now. A pullback would simply prove a desirable aspect of any healthy bullish trend. And least we validate our notions of equity sentiment by way of risk sentiment associated with the CBOE Options total put/call ratio.

We've since bumped off of the lows recently seen in the put/call ratio, but the current level still suggests bullish positioning associated with overbought market conditions. As far as equities themselves, from the sector level we can also see overextended or overbought levels that align with the number of stocks trading above their 50-DMA.
To end the week, the Nasdaq 100 moved into extreme overbought territory and, according to Bespoke Investment Group, the short-term timing score is now 'Poor'. The only sector ETFs not in overbought territory, but still found above their 50-DMA are mid and small-cap sector ETFs. This, with yields faltering this past trading week, should come as no surprise as smaller cap stocks are more sensitive to treasury yield declines. Before we shows the relative weakness from small caps when compared to large caps, we are forced to identify one of those breadth divergences that has popped up again.
As shown in the chart above, while the S&P 500 continues higher, likely supported by its larger-cap constituency, the total number of stocks trading above their 50-DMA has declined in the last couple of trading sessions, although higher for the week. The same can be seen from the number of stocks trading above their 20-DMA as shown in the chart below:
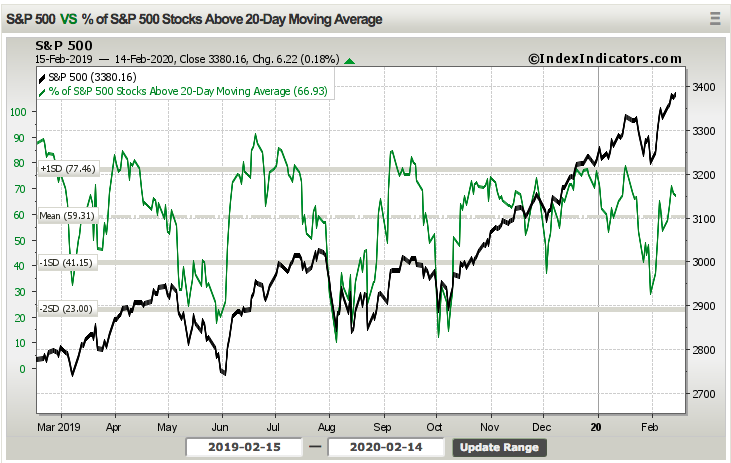
The number of stocks trading above their 20-DMA has improved from 53% in the previous week to nearly 67% in the past trading week. Despite popular belief or the weakening seen in high beta stocks, overall breadth has improved this past trading week. Nonetheless, I can't dismiss that eventually a correction will be found and a starting point for that corrective phase can be found in high beta issues weakening coupled with small-cap weakness. We see this small-cap weakness coinciding with none other than lower treasury yields. (Chart from J.C. Parets)

While the S&P 500 has continued to defy COVID-19 headlines, the bond market has been pricing in the desire of investors and asset managers to accrue assets that are dollar-denominated. This, in part, has played a role in boosting U.S. equity performance, but also boosted the price of U.S. Treasurys in kind. As prices go up, yields go down. The other factor at play in Treasury prices, of course, is fears from COVID-19 impact on economic activity.
So here's the broad takeaway from the numerous charts, breadth and relative performance analysis. There are some segments of market performance that are starting to identify risk-averse behavior and other areas of the market which are diverging from the broader index performance. Breadth remains at healthy levels, but with index levels very exposed to limited upside potential and headline risks pointing to greater downside probabilities in the near-term. All this, while yields continue there path lower is also weighing on the financials and banking stocks. (Chart from David Keller)
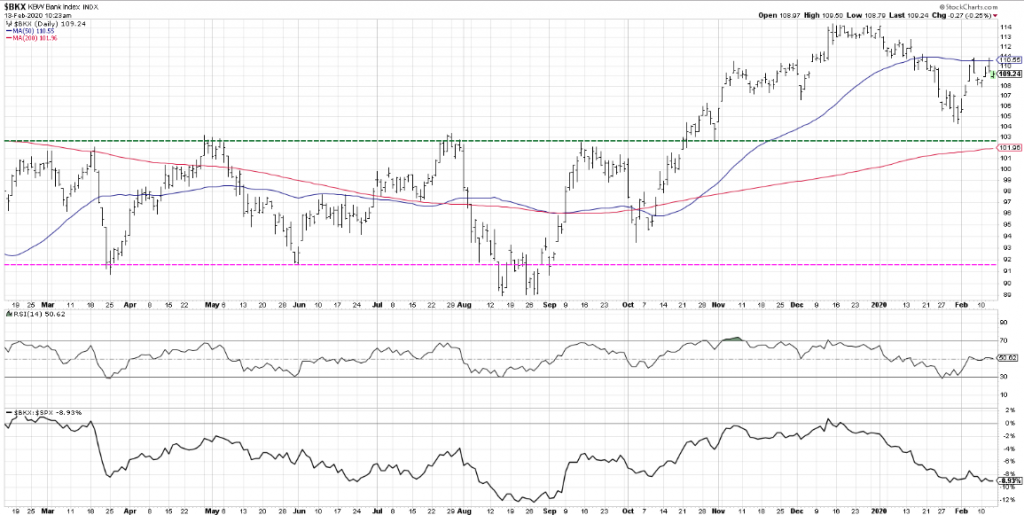
Weakness in financials is definitely a concern, given that high beta and small caps have been underperforming lately also. The banks index appears to be failing at the 50-DMA twice now and the relative strength is questionable at this point. Can the market rally without financials? Sure. But I'd rather have the financials found for strength rather than weakening given the aforementioned areas already showing weakness in the market and given overbought conditions on the whole.
"But Treasuries and yields rallied together in 2019, why not now"? To be clear, I'm not suggesting this can't repeat again, as it has been the case to-date in 2020. A bigger forest for the trees extrapolation might be that we are simply recognizing there is a long runway yet to go in the year, corrections are healthy and to be expected and it may simply be time to take the foot off the proverbial gas pedal for the time being, letting the market find greater certainty with forward-looking earnings and the macro issues of the day. Having cash on the sidelines, can be put to work over the coming weeks and months and if/when some of the wall of worry bricks don't prove to limit earnings and economic growth.
Economic Data of the Week
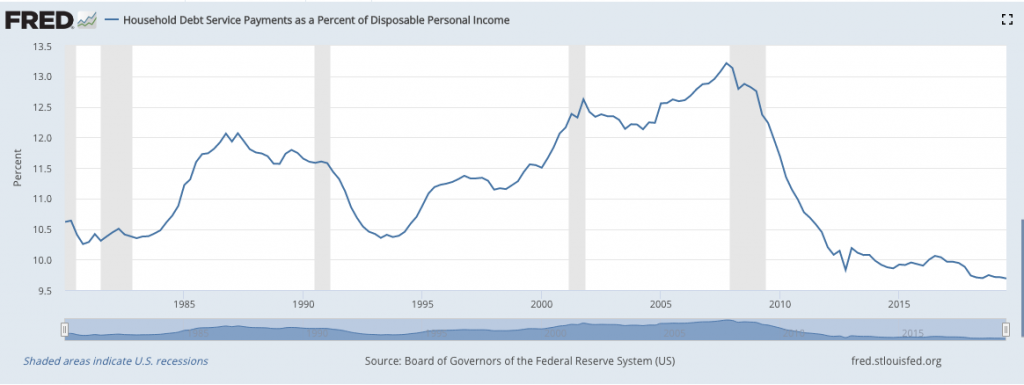
Every week investors are asked to digest a plethora of economic data reports. No one report is THE report that will determine the trajectory of markets over time. Nonetheless, the economic data I pay more attention to are those that do define the trajectory of a consumer-driven economy. Job growth leads to consumer spending, which leads to retail sales growth, which in turn, leads to more job growth. It's a positive feedback loop, especially when the household balance sheet is found with exceptional discretionary spending levels. This remains the most important chart for the current economic cycle and since the great deleveraging began, post the Great Financial Crisis.
To kick off the past trading week, the JOLTS survey gave investors some indigestion as it showed a slowdown in hiring tied to a softening economy. Although job opening are still relatively high and hiring is steady, economists say the sharp drop toward the end of 2019 is a bit worrisome.
Job openings sank to 6.42 million in December from 6.79 million, the Labor Department said Tuesday. It’s the second significant decline in a row and openings have fallen by more than 1 million in the past 12 months.
Over the month, hires and separations were little changed at 5.9 million and 5.7 million, respectively. Within separations, the quits rate and layoffs and discharges rate were unchanged at 2.3% and 1.2% respectively. The number of quits was little changed in December at 3.5 million and the rate was unchanged at 2.3 percent. Quits decreased in retail trade (-111,000) and arts, entertainment, and recreation (-20,000).
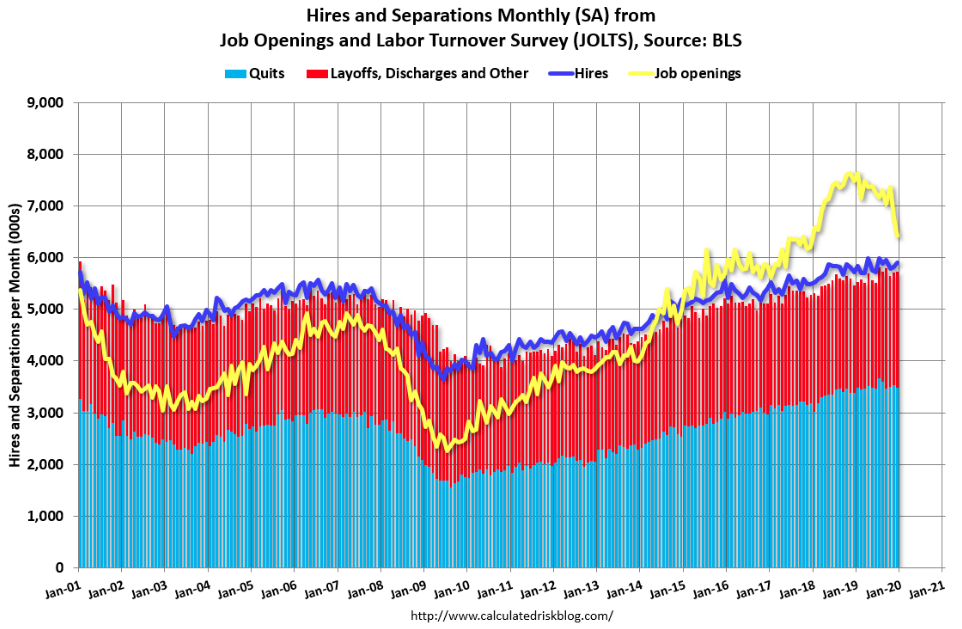
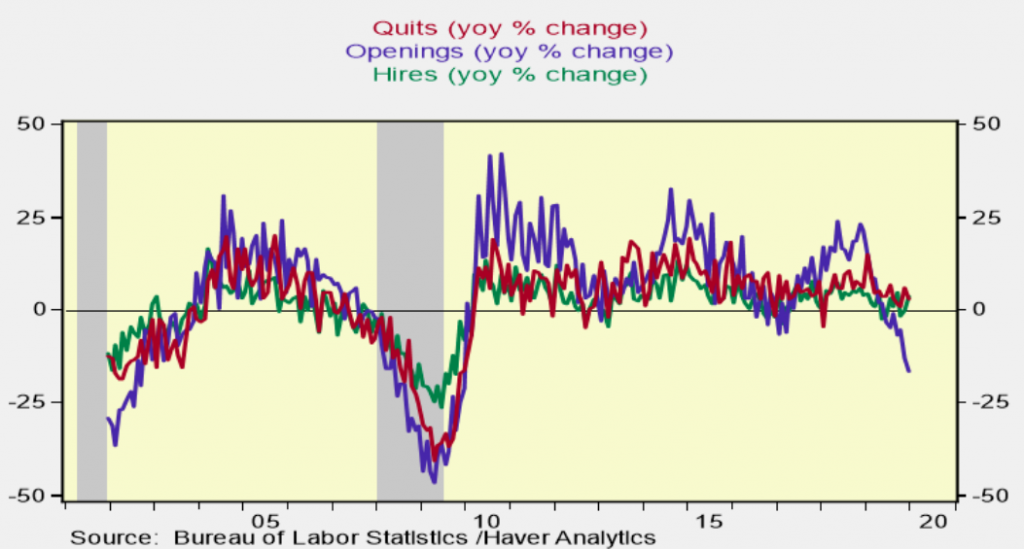
On the surface, the large decline in job openings/vacancies seems to display weakness in the labor market. A closer look reveals that the number of job openings is simply normalizing. Openings were way stronger than the other components (hires and quits) in 2018 and now they are overshooting on the way down, normalizing. (See chart below)
“It is possible the decline in job openings represents in part better job matching (greater willingness of employers to hire and train workers) rather than a cautionary signal .. but these data should be watched closely in upcoming months.” – RDQ Economics
Here is what Capital Economics had to say about the drop in job openings as well. Within their commentary, they suggest this is normalization in JOLTS and doesn't seem concerning when juxtaposed with Payroll Employment data.
“.. it is unusual for job openings to see sustained falls outside of recessions and the 14% y/y contraction in December was the sharpest since 2009. There is no evidence that it will presage a broader downturn in labour market conditions.” JOLTS has never “had much of a relationship ... the weakness .. is at odds with the strong rebound in payroll employment growth over the past six months.”

My last point of analysis related to the drop in job openings comes from J.P. Morgan:
"The recent changes may be a bi-product of disgruntled employers. With the unemployment rate at 3.6%, the U.S. labor market is at its tightest level in over 50 years. Disgruntled employers, unable to find workers with the necessary skills and tired of the expensive and time-consuming process of advertising openings, may have opted to pull the opening altogether."
While I do feel that job openings have simply caught down to a more normalized level that is in keeping with a healthy economy, the latest small business survey gave investors reason to remain optimistic about the future trajectory of economic activity. The National Federation of Independent Business said its index of small-business optimism rebounded from a small dip in at the end of last year, rising to 104.3 points in January from 102.7 in December.
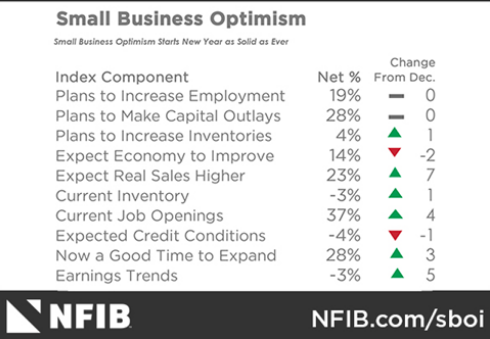
Business owners were more confident that sales would continue to rise and help support higher profits, the NFIB said. The biggest worry of small businesses continues to be a shortage of skilled employees available for hire. A quarter of owners say it’s their No. 1 problem. Many say they’ve increased wages and benefits to attract talent. In January, six of the 10 Index components rose, two fell and two were unchanged.
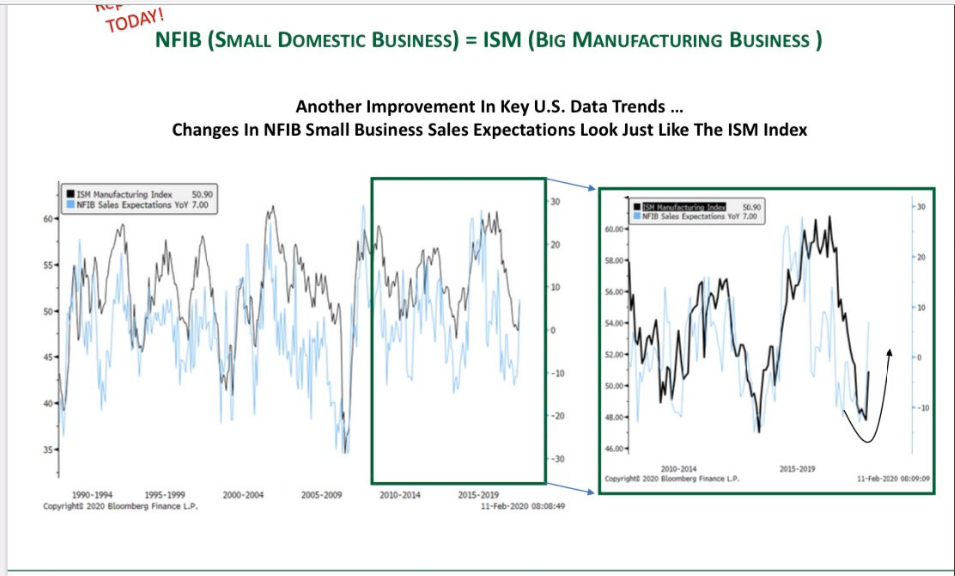
After reviewing the NFIB sales expectations data, we can't help but to think it has mirrored the movement in the ISM Manufacturing data recently. As Michael Kantrovitz of Cornerstone Macro Research points out, "It’s helpful to not only have a process but also know which data we can look to for confirmation. The NFIB survey came out and corroborated the strong ISM Manufacturing reading from the previous week. We are watching consumer confidence and claims to gauge unfolding a risks."
Moving on to the U.S. consumer, this past week's is a measure that gauges the sentiment of the consumers is found in Gallup's annual Mood of the Nation survey. In the report released a little more than a week ago, the survey notes a record 59% of Americans indicate they are financially better off than they were a year earlier.

Looking ahead, Gallup asked Americans' expectations about their financial picture in the year to come. Gallup notes the response to this question, "Americans are also expressing peak optimism about their future personal financial situation. About three in four U.S. adults (74%) predict they will be better off financially a year from now, the highest in Gallup's trend since 1977."

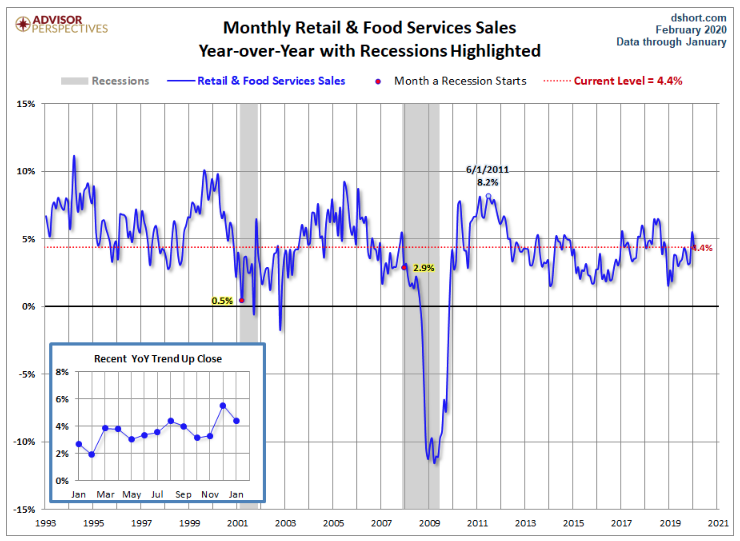
Also pertaining to the consumer, retail sales data released on Friday proved a mixed bag, but still points to record retail sales in 2020. Retail sales climbed 0.3% last month and 4.4% YoY, the government said Thursday, matching most economists' forecast. About half of the increase last month, however, was generated by home centers such as Home Depot and Lowe’s that sell lots of building supplies to small businesses. Sales were soft in most other segments of the retail industry that largely cater to households.
At the category, sales level declined at gas stations owing to lower prices at the pump. Sales also fell a steep 3.1% at clothing stores, the biggest decline since 2009. Warmer than usual temperatures likely depressed purchases of cold-weather apparel. Other segments that posted lower sales included pharmacies, department stores and stores that sell electronics and appliances.
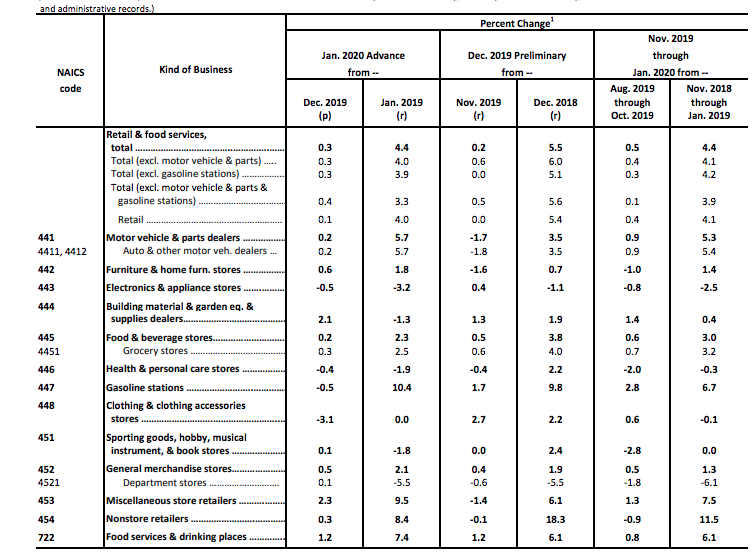
Department store results have continued to outpace declines for several years and on a YoY basis. In the most recent period, Department store sales fell some 5.5% as reported by the Census Bureau.
Sales for December and November were both reduced a tick to show a 0.2% increase in each month, reflecting somewhat softer business conditions at the end of the year.
The next couple of weeks could prove critical for markets as earnings season begins to wind down and with consumer packaged goods, restaurants and retailers due to report Q4 2019 results alongside issuing FY2020 guidance. Wal-Mart (WMT) sets the stage for this coming week, as it will report results before the opening bell. Wal-Mart is one of the few big-box chains that doesn't offer a holiday sales update. When Target (TGT) released it's holiday sales update, the share price took a massive hit as same-store sales materially underperformed the company's own expectations for the period. As it pertains to Wal-Mart's quarterly release to come, here is what Morgan Stanley offered this past week:
“We don’t think WMT was immune to the headwinds TGT faced in the weaker product categories it called out, and it may also have been affected by the shorter holiday period,” warns Morgan Stanley
Lastly, and what forced Q1 GDP forecasts lower for the week was the expected drop in Industrial Production. Industrial production fell 0.3% in January, marking the fourth decline in the past five months, the Federal Reserve reported Friday.
The decline mainly reflected warmer weather, which cut utility output, and a significant slowdown in civilian aircraft production, down 7 percent. Boeing Co. (BA) suspended 737 MAX production in January.
Factory activity edged down 0.1% in January. Excluding civilian aircraft, manufacturing rose 0.3 percent. Like the Durable goods and monthly Retail sales reports, in order to get a better understanding as to why the report was weak, we have to look under the hood to validate or invalidate the headline number.
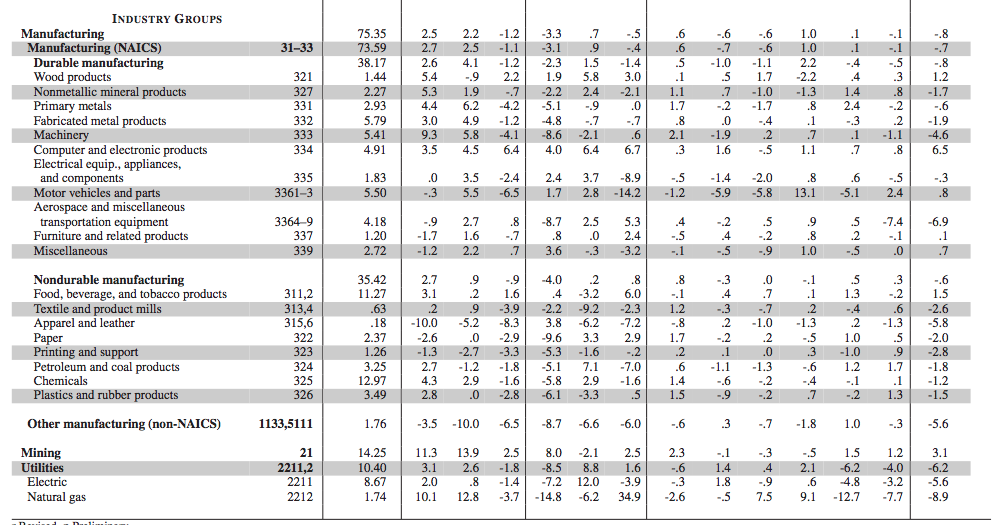
The table above shows that the production of autos and parts rose 2.4% in January, a partial rebound from a 5.1% decline in the prior month. Utilities production fell 4% in January, because of the warm weather. An there is that Boeing impact that we had discussed which also will likely serve as a drag on overall GDP for the Q1 2020 period. In January, aerospace accounted for 7.4% of the monthly decline in Industrial Production. The only bigger drag on the data came from Natural gas.
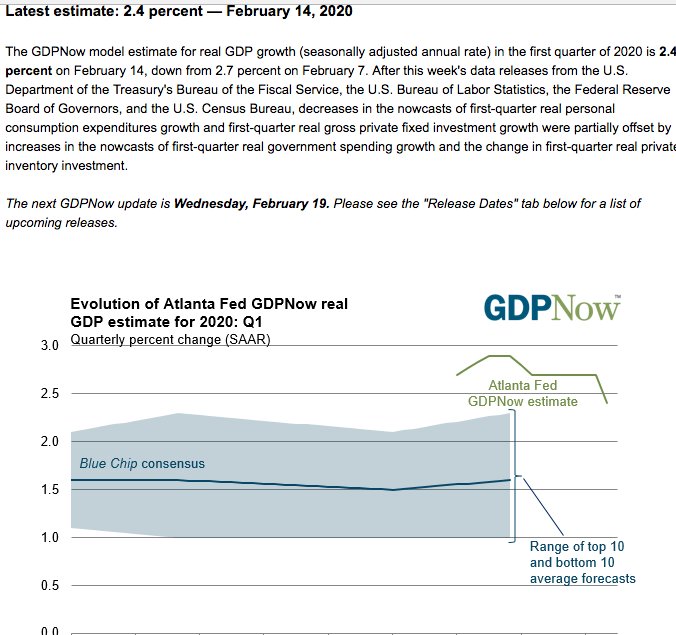
Nonetheless, when all the data was said and done with for the week, the Atlanta Fed was forced to revise its GDPNow forecast from 2.7% growth at the start of the week down to 2.4% growth for the Q1 period.
Other GDP forecasts for the Q1 2020 period are as follows:
- From Merrill Lynch: The data cut our 4Q 2019 GDP tracking estimate by 0.1pp to 2.0% and our 1Q 2020 estimate by 0.3pp to 0.7% qoq saar. [Feb 14 estimate] emphasis added
- From the NY Fed Nowcasting Report: The New York Fed Staff Nowcast stands at 1.4% for 2020:Q1. News from this week’s data decreased the nowcast for 2020:Q1 by 0.3 percentage point. [Feb 14 estimate]
- Goldman: “Following this morning’s data, we lowered our Q1 GDP tracking estimate by three tenths to +1.4% (qoq ar).”
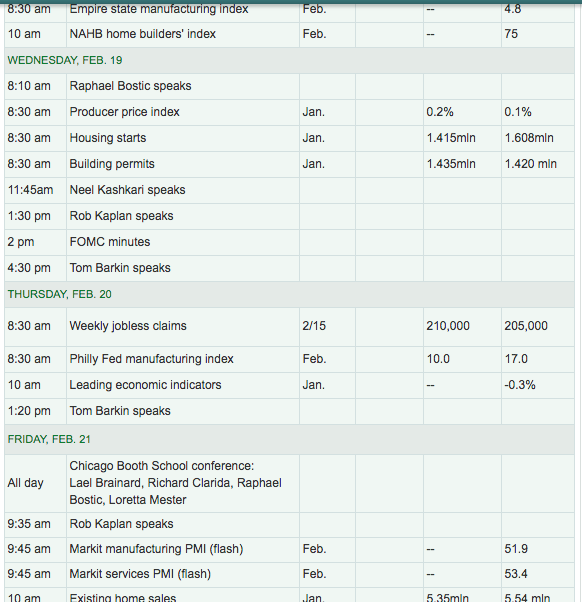
For the coming week, the economic data will focus on housing and manufacturing. Financial markets are closed Monday and come Wednesday, investors will also be delivered the latest FOMC minutes. We don't anticipate the minutes to prove market-moving given the steadfast testimony from Fed Chairman Jerome Powell before Congress this past week.
Port Activity as Measurable Impact From COVID-19
I still believe economic growth will remain supportive to an earnings growth rebound in 2020. The COVID-19 impact is uncertain presently but is also likely to ONLY postpone economic activity and earnings growth, NOT to eliminate such activity and growth in 2020. While I recognize warning signs in certain of the economic data series and by way of the COVID-19 concerns that accompany the slowdown in economic activity from the world's 2nd largest economy, the ability to measure the impact domestically still remains muted and begs of caution on the part of traders. What we can measure, however, is the all-too relevant port activity.
Imports at major U.S. retail container ports are expected to see a sharper-than-usual drop this month, according to the Global Port Tracker report released today by the National Retail Federation and Hackett Associates.
“February is historically a slow month for imports because of Lunar New Year and the lull between retailers’ holiday season and summer, but this is an unusual situation,” NRF Vice President for Supply Chain and Customs Policy Jonathan Gold said. “Many Chinese factories have already stayed closed longer than usual, and we don’t know how soon they will reopen. U.S. retailers were already beginning to shift some sourcing to other countries because of the trade war, but if shutdowns continue, we could see an impact on supply chains.”
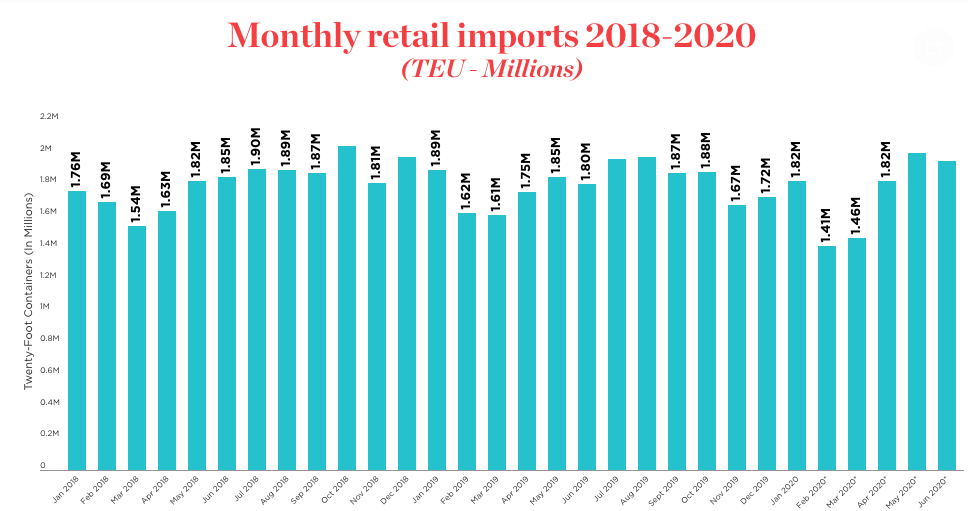
“Projecting container volume for the next year has become even more challenging with the outbreak of the coronavirus in China and its spread,” Hackett Associates Founder Ben Hackett said. “It’s questionable how soon manufacturing will return to normal, and following the extension of the Lunar New Year break all eyes are on what further decisions China will make to control the outbreak.”
January was estimated at 1.82 million TEU, down 3.8% from January 2019. February is forecast to be down 12.9% year-over-year at 1.41 million TEU and March is expected to down 9.5% year-over-year at 1.46 million TEU. Before the coronavirus outbreak, Global Port Tracker had forecast February at 1.54 million TEU and March at 1.7 million TEU.
While the duration of the coronavirus impact remains unknown, April is currently forecast at 1.82 million TEU, up 4.5% year-over-year; May at 2 million TEU, up 8.3% and June at 1.95 million TEU, up 8.5 percent. Those numbers would bring the first half of 2020 to 10.47 million TEU, down 0.4% year-over-year.
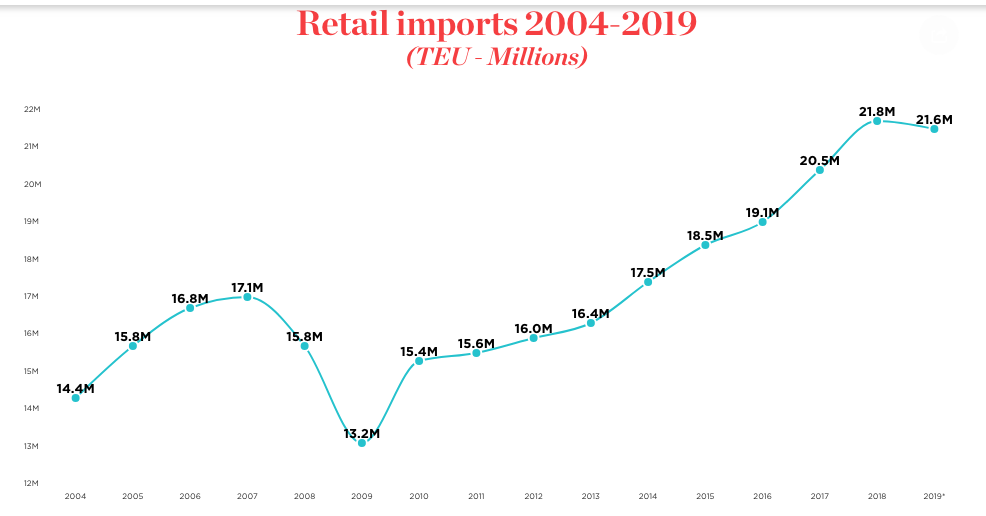
Most of the declining retail imports from 2108-2019 came via the front-loading of inventories shortly after the trade war commenced in July 2018. But now that those inventories have largely been drawn down, retailers months of supply may be stressed if COVID-19 proves a more protracted issue for China, which is the largest manufacturing hub for the world's retail industry and for which supply lines are attached.
My chief concern related to current Chinese provinces remaining quarantined and without meaningful resumption of normal business operations is that it constrains Europe and U.S. commerce, which may also bleed into the labor and employment data. We are carefully monitoring the situation but would become increasingly cautious on the Q2 economic outlook if Chinese business operations don't increasingly normalize in the coming weeks. Here is what Goldman Sachs offered on the very same topic of concern:
GOLDMAN: “At this point we cannot rule out Chinese production shortfalls continuing into March ... Conceding two-sided uncertainty around this impact, .. we are boosting our estimate of the Q1 virus drag on GDP growth to 0.5-0.6pp (from 0.4-0.5pp previously).”
Earnings Outlook
The earnings outlook for Q4 2019 has come full circle, as we had forecasted. Ahead of the earnings season, both FactSet and Refinitive forecast a YoY earnings decline of 1.8% and 1.4% respectively. Fast-forward to the present day and earnings are materially surprising to the upside, driving the tracking for Q4 2019 EPS into positive territory.
According to FactSet the blended earnings growth rate for the S&P 500 for the fourth quarter is now 0.7% as of February 7. This growth rate is above the estimated earnings decline of -1.8% at the end of the quarter (December 31).
Insight/2020/02.2020/02.13.2020_TOW/S&P%20500%20Earnings%20Growth%20Rate%20Q4%202019.png?width=912&name=S&P%20500%20Earnings%20Growth%20Rate%20Q4%202019.png)
In aggregate, positive earnings surprises reported by S&P 500 companies have led to a net $8.5 billion increase in earnings for the index since December 31 (as higher actual earnings replace estimated earnings in the growth rate calculation).
The Information Technology sector is the largest contributor to this increase in earnings, accounting for $5.4 billion of the net $8.5 billion increase (or about 63%). The positive earnings surprises reported by Apple ($4.99 vs. $4.55), Microsoft ($1.53 vs. $1.32), and Intel ($1.52 vs. $1.25) were substantial contributors to the increase in earnings for the index during this time. As a result, the blended earnings growth rate for the Information Technology sector improved to 5.1% on February 7 from -1.9% on December 31.
Outside of the Information Technology sector, the positive EPS surprises reported by Alphabet ($15.35 vs. $12.49) and Amazon.com ($6.47 vs. $4.04) were also significant contributors to the increase in earnings for the index since December 31.
The most important aspect of earnings season is the outlook, given the cyclical high P/E multiple (18.8) for the S&P 500 forward-looking estimates. At 18.8, the multiple is priced for perfection and leaves the market vulnerable to negative earnings-related surprises from the Q1 2020 period. It's with this in mind that we concern ourselves with what CEOs are saying about COVID-19 on conference calls and aim to discover if the issues is represented in a change in the corporate outlook.
FactSet found that 138 companies issuing Q4 earnings calls cited COVID-19 as an issue going forward.
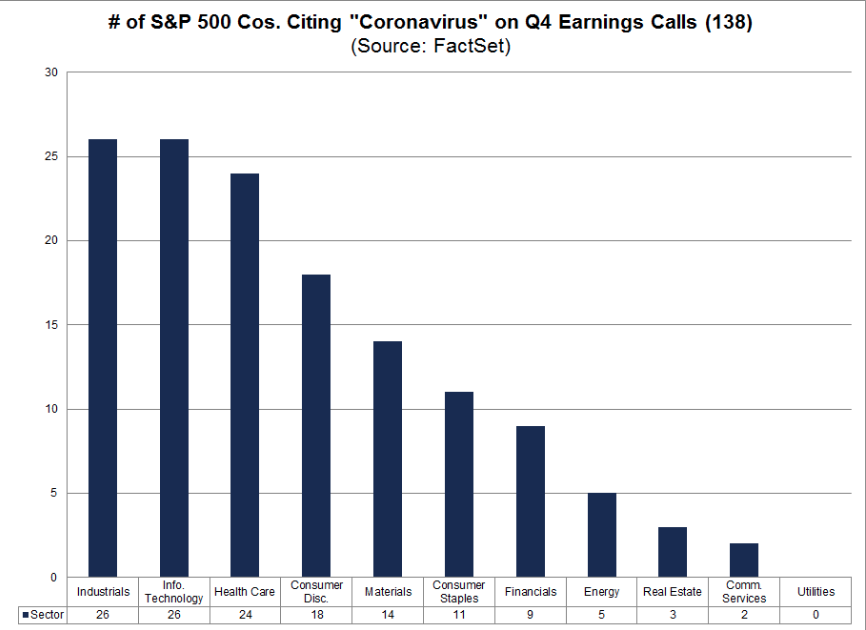
What's most relevant to investors here is the U.S. entities exposure to COVID-19 through China. For the 138 companies that discussed the coronavirus on their earnings calls for Q4, the average revenue exposure to China is 7.2 percent. For all S&P 500 companies, the average revenue exposure to China is 4.8 percent.
As it pertains to updated guidance given the COVID-19 issue, unfortunately like many investors, the impact remains unknown and demands more time to present itself.
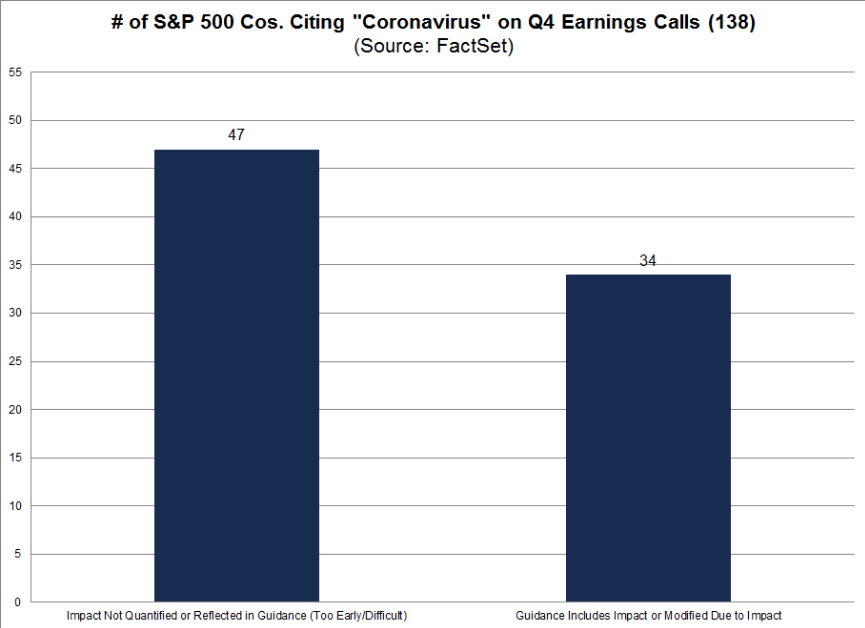
As shown in the chart above, a larger number of companies did not update or modify guidance due to the impact of coronavirus. It's possible that there will be an increase in the number of companies issuing negative guidance later in the first quarter, as these companies gain clarity on the impact of the coronavirus on their businesses. The opposite is, of course, a possibility also and assuming China further normalizes business and commerce operations near-term.
To date, guidance issued by S&P 500 companies for Q1 2019 has been less negative than average. In terms of EPS guidance for Q1 2019, 51 S&P 500 companies have issued negative EPS guidance and 25 have issued positive EPS guidance. The percentage of companies issuing negative EPS guidance is 67% (51 out of 76), which is below the five-year average of 70 percent. In terms of revenue guidance for Q1 2019, 33 S&P 500 companies have issued negative revenue guidance and 27 have issued positive revenue guidance. The percentage of companies issuing negative revenue guidance is 55% (33 out of 60), which is below the five-year average of 57 percent.
Like FactSet, Refinitiv's Q4 2019 EPS tracking has moderated higher as the earnings season has carried forward. Their latest forecast is as follows:
Aggregate Estimates and Revisions
- Fourth-quarter earnings are expected to increase 2.6% from 18Q4. Excluding the energy sector, the earnings growth estimate is 5.5%.
- Of the 387 companies in the S&P 500 that have reported earnings to date for 19Q4, 71.6% have reported earnings above analyst expectations. This compares to a long-term average of 65% and a prior four-quarter average of 74%.
- 19Q4 revenue is expected to increase 5.1% from 18Q4. Excluding the energy sector, the growth estimate is 6.4%.
The forecast has moved significantly higher for both revenues and EPS. Refinitiv's EPS model was calling for a rise of just 1.1% as of the previous week. I don't anticipate, even with the retailers earnings season upon us, that the Q4 2019 EPS will prove to grow any less on a YoY basis. The following graphic identifies some key earnings releases for the coming week:

Unfortunately, the reports to come are offered with hindsight and likely already priced into the market's stretched multiple. Going forward, investors will need to be mindful of analysts' revisions with respect to the Q1 2020 EPS estimates. Should COVID-19 prove to elongate the period of economic suppression in China, we might witness analysts cut their Q1 EPS estimates at the beginning of March, which may also prove to halt the equity market rally temporarily. The unknowns surrounding a resumption of normal Chinese business and transportation operations remains a wild card in the 2020 economic and EPS forecasts. It continues to bear monitoring as the fluidity of the situation moves from one week to the next. At present, this remains the risk for market downside.
Investor Takeaways
Technically speaking, the bullish trend is intact, healthy, but found with overbought conditions that tend to resolve themselves sooner rather than later. While we continue to believe the first line of support for any new decline will probably occur at the 50-DMA (now 3,254), given where the most recent pullback found support, we will now be watching 3,214 as well. Below that, keep an eye on the -10% correction line of 3,041 and the old support line of 3,025, which we show on the following chart.

Moreover, my chief suggestion to traders remains that market breadth is or has hit extreme levels once again, most notably in the Nasdaq's A/D index 10-DMA. It is currently at levels that are met with profit-taking, if not outright selling pressure. (Chart below)
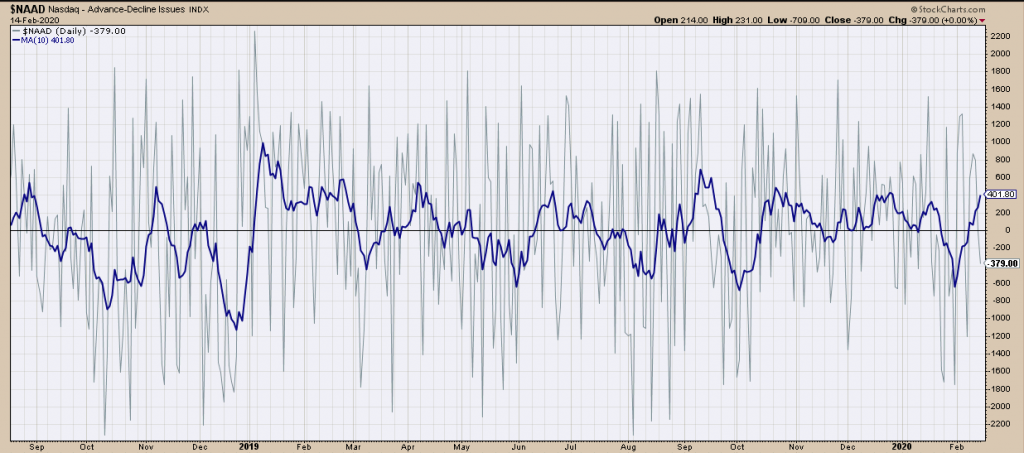
Usually, when the Nasdaq's A/D 10-DMA breaks above 400, it doesn't stay there very long. While this short-term breadth signal has reached such a level, traders are offered an opportunity to digest the signal for potential portfolio rebalancing purposes. This is not a sell signal in a bull market that I believe will continue in 2020, even if it continues with the usual intermittent drawdowns. Additionally, I cannot deny the following:
- On a weekly basis, the market backdrop remains bullish with a weekly buy signal still intact.
- However, that buy signal is extremely extended and has started to reverse with the market extremely overbought on a weekly basis.
- This is an ideal setup for a bigger correction so some caution is advised.
- With the S&P 500 trading above 2-standard deviations, and testing the third, of the intermediate-term moving average, some caution is suggested in adding additional exposure. A correction is increasingly probabilistic over the next month, which should provide an improved opportunity. Patience and caution, patience and caution. Refer to your shopping list if a correction ensues.
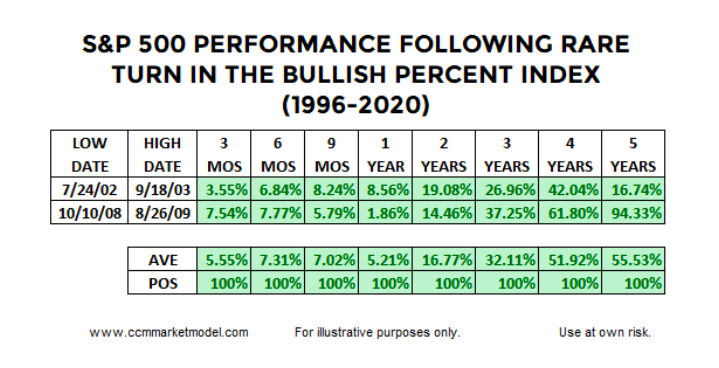
It's important to recognize the rationale for our longer-term market sentiment is also correlated, in part, to other market technicals and/or breadth indicators. Recall just a couple of weeks back I had highlighted the S&P 500's Bullish Percent Index (BPSPX).
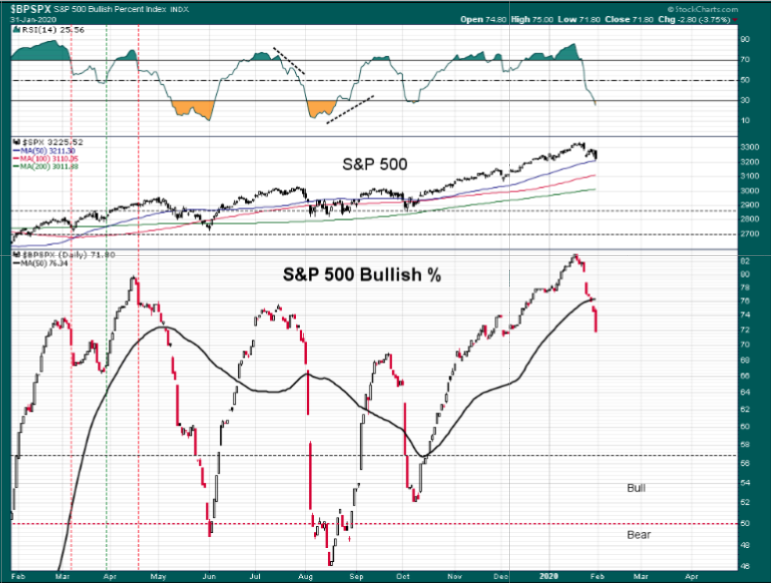
"The top box is the S&P 500 RSI (Relative Strength Index). Quite obviously, as the market retreated sharply this past week, the RSI also fell sharply and indicated broad-based selling pressure. The S&P 500 bullish percent index also fell sharply, but more importantly are 2 points of interest identified in the chart that lend themselves to forward-looking expectations."
- S&P 500 bullish percent remains in bullish territory even after the sharp decline in breadth.
- However, like the NASDAQ, it had a reversal of fortunes with the MA (moving average) cross. Given the drop below the BPSPX-MA, history suggests a continuation of the down move in the coming week and before any potential, sustainable rebound in the SPX itself.
In the notes concerning the BPSPX above, clearly the downward move in the S&P 500 did not continue, suggesting that indeed, history doesn't always repeat and investors have continued to seek greater yield in equities. But looking beyond the simplicity in the chart of the BPSPX above, what begs deeper discovery is the topping pattern, which it recently found at BPSPX 83. Take another quick look at the chart folks.
The BPSPX index had only reached such a level or greater 2 other times since the turn of the century. We know it's a small sample size, but let's take a look at what happened when this signaled in the past.
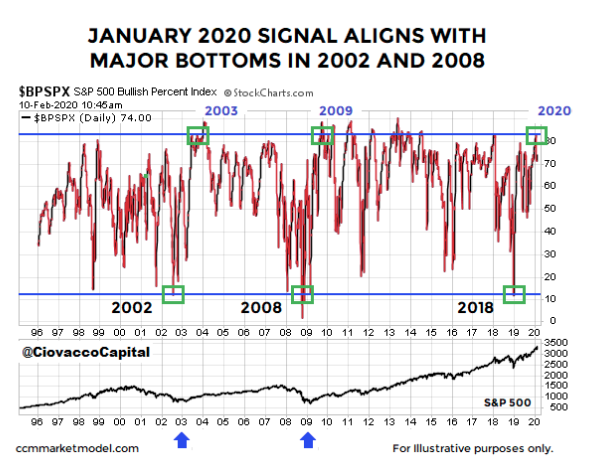
So while we spoke to traders using the Nasdaq's A/D 10-DMA as possibility igniting some profit-taking in the near-term, the BPSPX index suggests something better for investors longer-term. Notice in the chart above from Chris Ciovacco, the S&P 500 makes very little progress in the six-month to a one-year window, telling us to keep an open mind about normal pullbacks and corrections. The signal above speaks to the long-term outlook as evidenced by the average gain of 51.92% looking out four years from the date of the signals (high date in table below). Do keep in mind the sample size is only 2.
Lastly, but certainly not least is the desire to associate the breadth indicators and trend in the major averages with confirming signals from the NYSE. Once we have that signal confirmed, we can usually find markets achieving new highs in the next 3-6 months. The past, once again, is not a guarantee of future results, although the probabilities are quite strong.
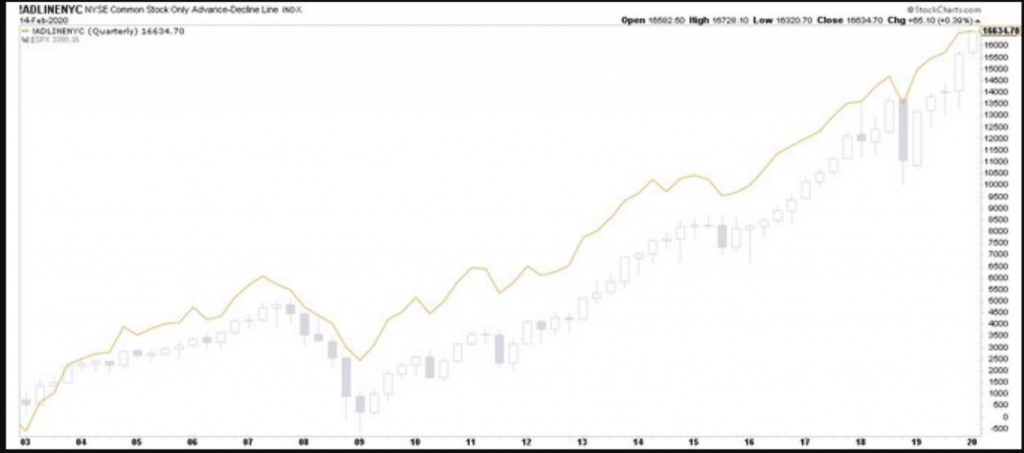
And indeed, the NYSE A/D line has executed a new all-time high this past week. The Common Stock Breadth making a new all-time high confirms the price action within the S&P 500.
The coming week is options expiration week for February, just something to consider. With this in mind let's take a look at historical data to see what we might expect above and beyond what market internals might suggest. (Trader's Almanac)
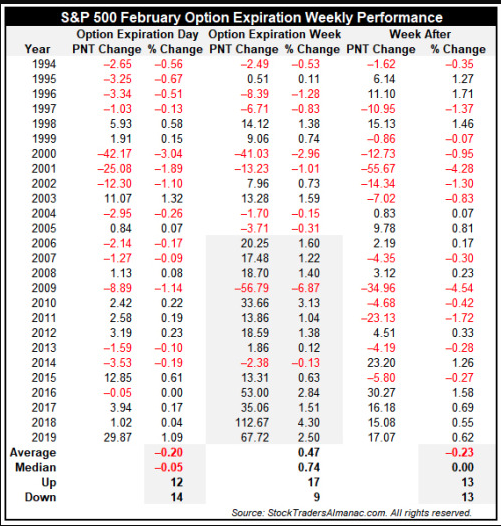
Options Expiration week as a whole nets an average gain of just 0.47% on the S&P 500 since 1994 with 17 of 26 winning weeks. More recently, the S&P 500 has advanced in twelve of the last fourteen options expiration weeks. The week after has been down 13 of the last 26 years. DJIA and NASDAQ have similar patterns over the same timeframe.
The market has performed as if it is invincible, over the last 13.5 months. I don't desire to see investors lulled into a false sense of security given the market's overwhelming resilience. Pullbacks have been brief, volatility has been tempered and equity fund flows have been weak but improving. All this while earnings had been flat, economic growth has been slowing, and global economic growth has been increasingly weaker, but not yet impacting the U.S. to any significant degree. And now an epidemic uprising in an economy of sizable impact... While central banks can certainly fight the economic impact from such an epidemic that has essentially shut down the Chinese economy, it remains to be seen if it can win the battle should "battle lines be drawn".
On the topic of market resiliency and with COVID-19 as a backdrop, Guggenheim's Scott Minerd offered some thoughts to clients on Friday of this past week:

"The cognitive dissonance in the credit market is stunning. I recently have had the feeling that I’m living peaceably in Britain during the 1930s while on the continent the Germans were building weapons, expanding their army and navy, and opportunistically grabbing land. I know this comparison may seem excessive, yet market participants seem to be indulging in a cognitive dissonance akin to when British Prime Minister Neville Chamberlain in 1938 confidently assured not just Britain but the world that there would be “peace for our time.” He told them to ignore all the red flags and assured them that two decades after the end of the Great War there would be no repeat of the global carnage. Two years later the Nazis were bombing Britain.
In the markets today, yields are low, spreads are tight, and risk assets are priced to perfection, but everywhere you look there are red flags. The latest red flag is the coronavirus.
Our estimate is that China’s Gross Domestic Product (GDP) growth for the first quarter could be slashed to -6 percent annualized from an already slow 6 percent in the fourth quarter. That could shave about 200 basis points off of global growth relative to its recent trend.
At the same time that China is being forced to shut down factories and quarantine workers, interruptions to the supply chain in the United States and Europe have yet to be felt. By most estimates, if the Chinese extend the lunar new year by two weeks it would not meaningfully impact the global supply chain, but if it went beyond two weeks then we would start to see problems for materials and consumer goods outside of China. Even if the virus does not turn into a pandemic, to think it isn’t going to impact what’s going on in the world is irrational.
For those investors who perceive the disconnect between risk assets which are priced for a rosy outcome and the reality of the looming risks to growth and earnings, any attempt to reduce risk leads to underperformance. It is a mind-numbing exercise for investors who see the cognitive dissonance. The frantic race to accumulate securities has cast price discovery to the side.
This will eventually end badly. I have never in my career seen anything as crazy as what’s going on right now. We are either moving into a completely new paradigm, or the speculative energy in the market is incredibly out of control. I think it is the latter. I have said before that we have entered the silly season, but I stand corrected. We are in the ludicrous season."
With respect to Minerd's thoughts, he's often found in error and with exaggerated forecasts. Nonetheless, we shouldn't be found for dismissing the uncertainty and extreme market conditions that have lent themselves unfavorably to the risk/reward proposition near-term. And that is what it comes down to as we look forward to the coming trading weeks and with asking ourselves, "Is the risk/reward proposition found with favor or should we tread cautiously given market and economic conditions being what they have been evaluated to be?"


This is a very professional article. It is balanced. Professional investors will find it useful. We hope Seth is right. Someone near retirement may lean toward cashing out some profits. The only analysis that I question is the low percentage S&P exposure to China. I thought it was much higher. It also may be true that Chinese workers have savings, which would allow them to stay out of the workforce longer than anticipated before returning to the factories.